
Figures & data
Table 1 Timing and Dosages of the Three Ingestion Protocols
Table 2 Participant Characteristics (N = 7; Mean ± SD)
Fig. 1 Serum Bicarbonate Concentration at Baseline, Post-ingestion. * Significantly different from placebo. † Significantly different from Acute SB
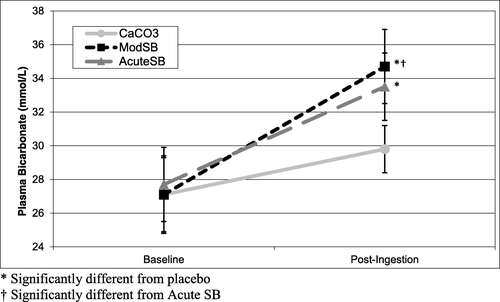
Table 3 Mean (± standard deviation) Blood Hematocrit, and Serum Bicarbonate (HCO3 −), pH, Sodium (Na+), and Lactate
Table 4 Individual serum bicarbonate values for each participant at baseline and post-ingestion
Availability of data and materials
The datasets used and/or analysed during the current study are available from the corresponding author on reasonable request.