
Figures & data
Table 1 Descriptive variables and caffeine intake
Fig. 1 1RM Performance in Bench Press and Squat. kg, kilograms 1 RM; one-repetition maximum; CAFF300, 300 mg of caffeine; TEA300, 300 mg of TeaCrine®; COMBO, 150 mg of caffeine and 150 mg of TeaCrine®; PLA, 300 mg of placebo. Data presented as mean ± SD
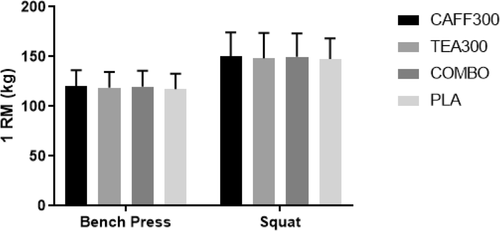
Table 2 Resistance and rowing performance in each treatment condition
Fig. 2 Repetitions to Failure Performance in Bench Press and Squat. RTF, repetitions to failure; #, number of repetitions; CAFF300, 300 mg of caffeine; TEA300, 300 mg of TeaCrine®; COMBO, 150 mg of caffeine and 150 mg of TeaCrine®; PLA, 300 mg of placebo. Data presented as mean ± SD
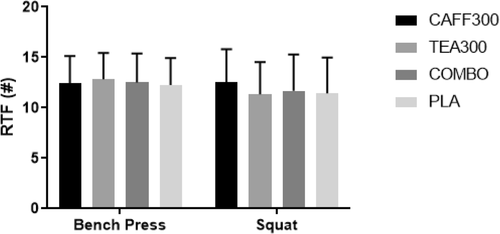
Table 3 Power and velocity for 1 RM and RTF bench press and squat for each treatment
Fig. 3 Perception of Energy. Differences between TEA300, CAFF300, COMBO, and PLA from Baseline to 90 min Post-Treatment in Perception of Energy CAFF300, 300 mg of caffeine; TEA300, 300 mg of TeaCrine®; COMBO, 150 mg of caffeine and 150 mg of TeaCrine®; PLA, 300 mg of placebo. TEA300-PLA, TEA300 vs. PLA; CAFF300-TEA300, CAFF300 vs. TEA300; COMBO-TEA300, COMBO vs. TEA300; CAFF300-PLA, CAFF300 vs. PLA; COMBO-PLA, COMBO vs. PLA; CAFF300-COMBO, CAFF300 vs. COMBO; cm, centimeters. *denotes significantly different (p < 0.05). Data presented as mean/percent change (95% CI)
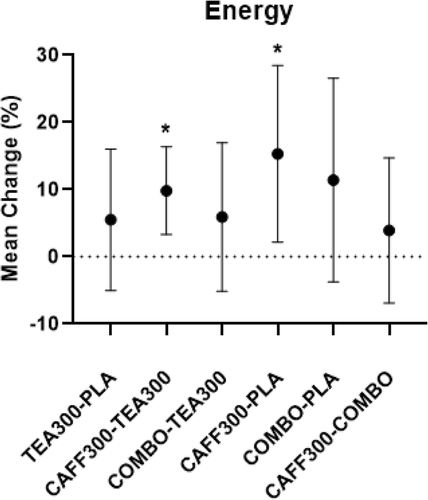
Fig. 4 Perception of Focus. Mean Differences between TEA300, CAFF300, COMBO, and PLA from Baseline to 90 min Post-Treatment in Perception of FocusCAFF300, 300 mg of caffeine; TEA300, 300 mg of TeaCrine®; COMBO, 150 mg of caffeine and 150 mg of TeaCrine®; PLA, 300 mg of placebo. TEA300-PLA, TEA300 vs. PLA; CAFF300-TEA300, CAFF300 vs. TEA300; COMBO-TEA300, COMBO vs. TEA300; CAFF300-PLA, CAFF300 vs. PLA; COMBO-PLA, COMBO vs. PLA; CAFF300-COMBO, CAFF300 vs. COMBO; cm, centimeters. *denotes significantly different (p < 0.05). Data presented as mean/percent change (95% CI)
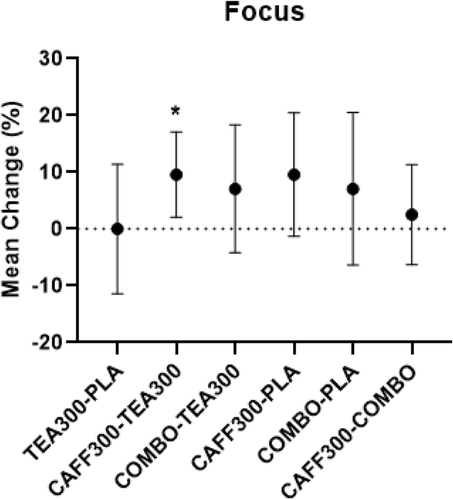
Fig. 5 Perception of Motivation. Mean Differences between TEA300, CAFF300, COMBO, and PLA from Baseline to 90 min Post-Treatment in Perception of Motivation.CAFF300, 300 mg of caffeine; TEA300, 300 mg of TeaCrine®; COMBO, 150 mg of caffeine and 150 mg of TeaCrine®; PLA, 300 mg of placebo. TEA300-PLA, TEA300 vs. PLA; CAFF300-TEA300, CAFF300 vs. TEA300; COMBO-TEA300, COMBO vs. TEA300; CAFF300-PLA, CAFF300 vs. PLA; COMBO-PLA, COMBO vs. PLA; CAFF300-COMBO, CAFF300 vs. COMBO; cm, centimeters. *denotes significantly different (p < 0.05). Data presented as mean/percent change (95% CI)
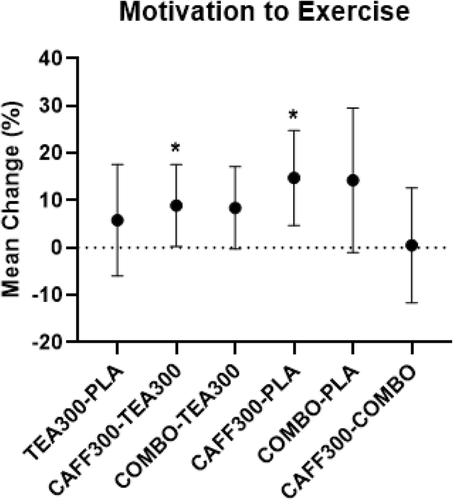
Fig. 6 Perception of Fatigue. Mean Differences between TEA300, CAFF300, COMBO, and PLA from Baseline to 90 min Post-Treatment in Perception of Fatigue.CAFF300, 300 mg of caffeine; TEA300, 300 mg of TeaCrine®; COMBO, 150 mg of caffeine and 150 mg of TeaCrine®; PLA, 300 mg of placebo. TEA300-PLA, TEA300 vs. PLA; TEA300-CAFF300, TEA300 vs. CAFF300; COMBO-TEA300, COMBO vs. TEA300; CAFF300-PLA, CAFF300 vs. PLA; COMBO-PLA, COMBO vs. PLA; COMBO-CAFF300, COMBO vs. CAFF300; cm, centimeters. Data presented as mean/percent change (95% CI)
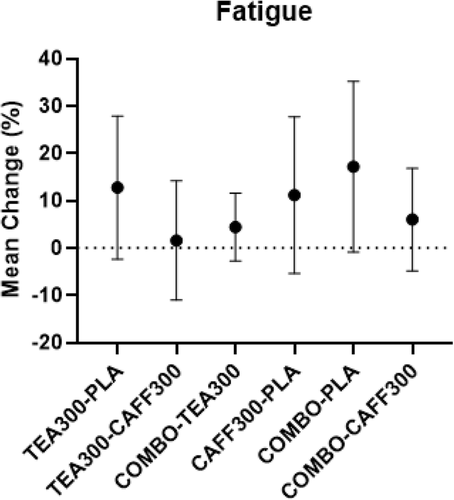
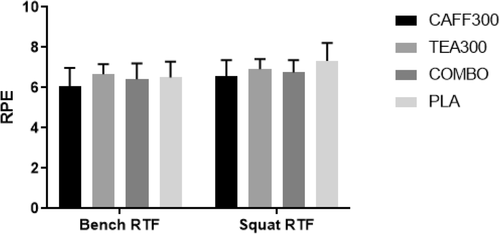
Fig. 7 Rating of Perceived Exertion After Bench Press and Squat. RPE, rating of perceived exertion; RTF, repetitions to failure; CAFF300, 300 mg of caffeine; TEA300, 300 mg of TeaCrine®; COMBO, 150 mg of caffeine and 150 mg of TeaCrine®; PLA, 300 mg of placebo. Data presented as mean ± SD
Availability of data and materials
The datasets used and/or analyzed during the current study are available from the corresponding author upon reasonable request.