
Figures & data
Fig. 1 PRISMA flow diagram of search and selection process
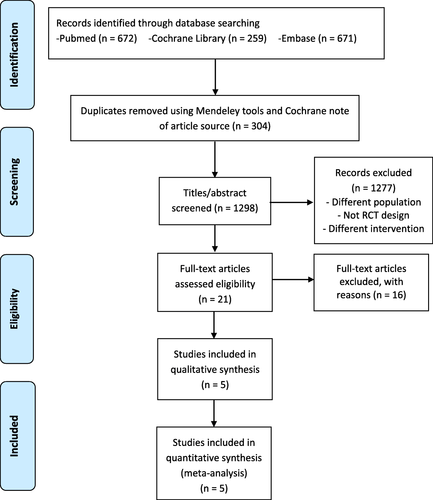
Fig. 2 Funnel plot for within study serum 25(OH)D difference between intervention and placebo for each trial at baseline. SE, standard error; MD, mean difference of serum 25(OH)D between intervention and placebo. Close 2013a included 2 different vitamin D3 dosage intervention groups in their study [Citation28]

Fig. 3 Cochrane risk of bias assessment. 2013a, 30 football and rugby athletes were recruited in reference Citation28; 2013b, 10 soccer players were recruited in reference Citation32
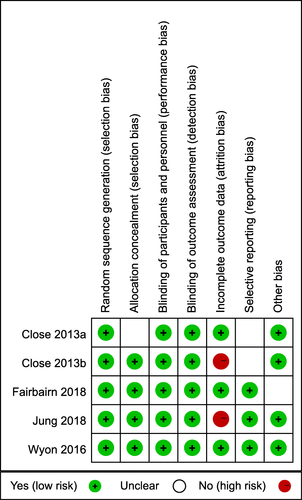
Table 1 Characteristics of the included randomized controlled trials
Table 2 Baseline measurements of the included randomized controlled trials
Table 3 Baseline and Follow-up Serum 25(OH)D concentrations
Table 4 Baseline and end-point mean 25(OH)D concentrations in vitamin D and placebo
Fig. 4 Forest plot for vitamin D3 supplementation effects on serum 25(OH)D status
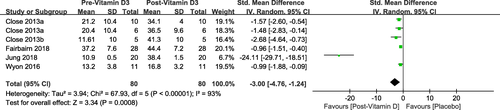
Fig. 5 Sensitivity analysis for vitamin D3 supplementation effects on serum 25(OH)D status
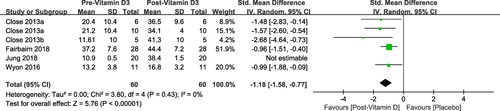
Table 5 Strength outcome measures
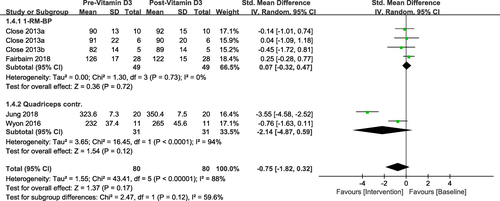
Fig. 6 Forest plot for vitamin D3 supplementation effects on muscle strength
Availability of data and materials
All data and materials have open access to the public upon reasonable requests.