
Figures & data
Table 1 Physiological characteristic from voluntaries
Fig. 1 Hemoglobin Saturation. SaO2% in hypoxia and hypoxia + CHO conditions for n = 8 volunteers. The results represent the mean ± SD. (a) Different from Rest (b) different from Post in Hypoxia and Hypoxia + CHO group
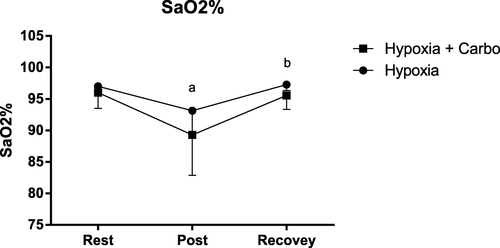
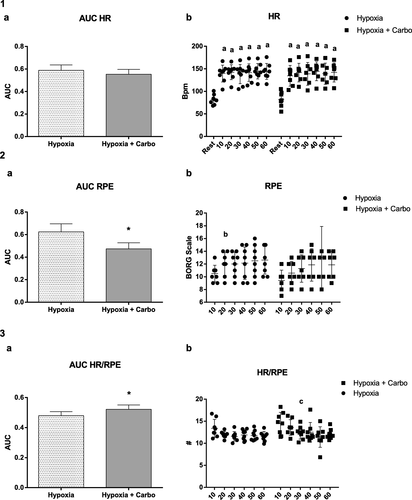
Fig. 2 HR and RPE. AUC – HR, RPE and HR/RPE in hypoxia and hypoxia + CHO conditions for n = 8 volunteers. 1(a) represents the AUC of Heart Rate, and 1(b) the Heart Rate during the different minutes. 2(a) represents the AUC of Rating Perception of Exertion, and 2(b) the Rating Perception of Exertion during the different minutes. 3(a) represents the AUC of the ratio of Heart Rate/Rating Perception Exertion, and 3(b) corresponds to the ratio of Heart Rate/Rating Perception Exertion during the different minutes. The results represent the mean ± SD. * different from Hypoxia, (a) different from Rest; (b) different from 10 min at Hypoxia Group; (c) different from 20 min in Hypoxia + CHO group
Availability of data and materials
The datasets used and/or analyzed during the current study are available from the corresponding author on reasonable request.