
Figures & data
Table 1 Participant Characteristics
Table 2 ANOVA results for all FMD variables
Table 3 Nutrient Consumption between Supplement Trials
Fig. 1 FMD percentages for each supplement group. Note. Results are presented as mean change post-supplementation; error bars are SD. * = Placebo group is significantly different from the Nitrosigine® group. Ŧ = Placebo group is significantly different than the citrulline malate group
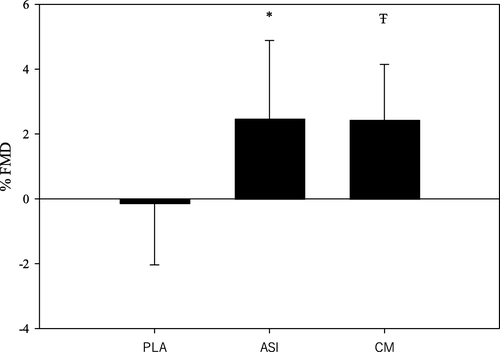
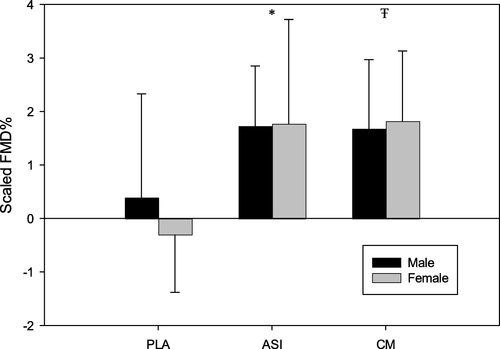
Fig. 2 Scaled FMD percentages for each supplement group. Note. Results are presented as mean change post-supplementation; error bars are SD. * = Placebo group is significantly different from the Nitrosigine® group. Ŧ = Placebo group is significantly different than the citrulline malate group
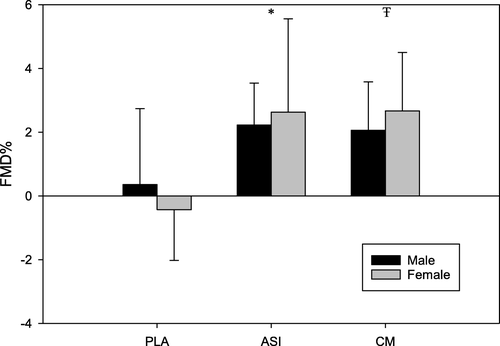
Fig. 3 Correlation between baseline diameter and FMD%. Note. Results are presented as mean change post-supplementation; error bars are SD. * = Placebo group is significantly different from the Nitrosigine® group. Ŧ = Placebo group is significantly different than the citrulline malate group
Availability of data and materials
The data generated and analyzed during this study are available from the corresponding author upon request.