
Figures & data
Fig. 1 CONSORT diagram
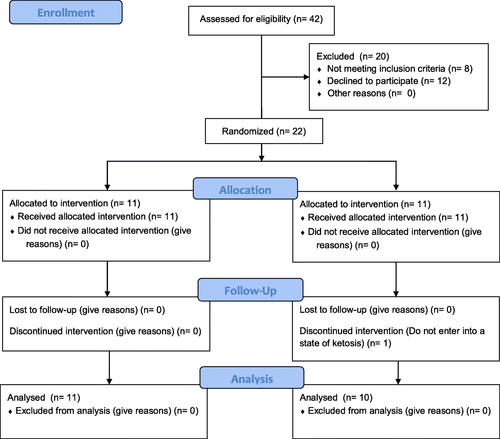
Fig. 2 Design of strength training. 1–0-1 = a second eccentric phase, zero isometric and 1 second in the concentric and 2–0-1 = 2 seconds eccentric phase, zero isometric and 1 second in the concentric; Training phases (strength, hypertrophy and muscular endurance) and goal repetitions according to established criteria by National Strength and Conditioning Association, NSCA [Citation33]

Table 1 Characteristics of participants at baseline
Table 2 Energy and macronutrients intake
Table 3 Results before and after the intervention by groups
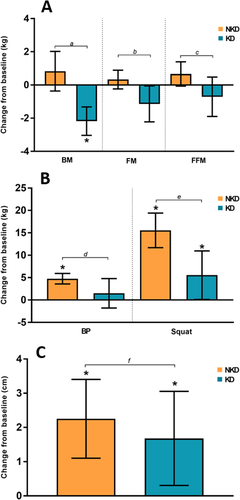
Fig. 3 a. Changes from baseline in BM (body mass), FM (fat mass) and FFM (fat-free mass); b. Changes from baseline in BP (bench press) and Squat; c. Changes from baseline in CMJ. Legend: The error bar represents the confidence intervals at 95% (95% CI); * when the 95% CI completely exceeds O, it is considered a significant change. The lowercase letters represent the P-value of the comparison between the groups: a = < 0.01; b = 0.012; c = 0.035; d = 0.035; e = 0.003; f = 0.478
Availability of data and materials
The datasets used and analyzed during the current study are available from the corresponding author on reasonable request.