
Figures & data
Fig. 1 PRISMA chart outlining identification of included studies
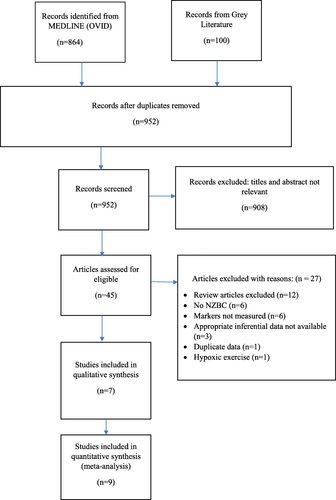
Fig. 2 Forest plot of performance effects of NZ BC compared to placebo. Results are expressed as standardized mean differences, and 95% confidence intervals (CI)
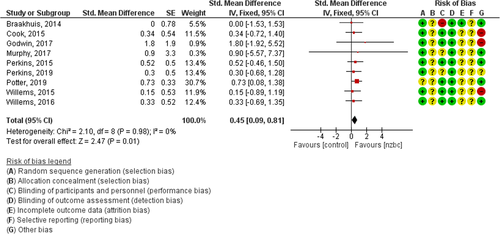
Fig. 3 Scatter plot of the studies that investigated oxidative stress markers before and after exercise, expressed as a post-:pre-exercise ratio. The horizontal dotted line represents no change compared with baseline. The solid horizontal line represents the geometric mean. MDA, malondialdehyde; PC, protein carbonyl
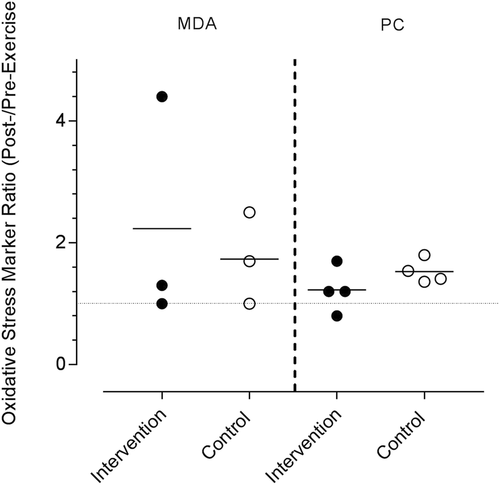
Table 1 Details of blackcurrant studies included in the performance meta-analysis
Table 2 Details of blackcurrant studies included which report oxidative, inflammatory, and cognitive outcomes
Additional file 1. Medline Search Strategy.
Download MS Word (13.1 KB)Availability of data and materials
Data used in this review have been sourced from available data and can be shared by contacting the primary author. The search strategy is available as supplementary information.