
Figures & data
Fig. 1 Flow-chart diagram
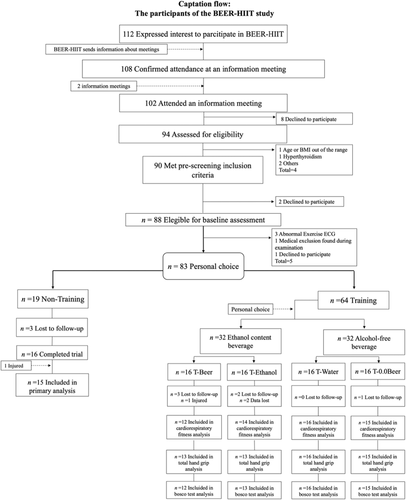
Table 1 Descriptive parameters before the intervention program
Fig. 2 Changes in maximum oxygen uptake (VO2max.) in absolute (a) and relative terms (b), maximal heart rate (c), and total test duration (d) before and after the intervention study. P-value [time, group, and interaction (time x group)] of repeated measure analysis of variance. ** p < 0.01, *** p < 0.001 for total sample, ö p < 0.05, öö p < 0.01, ööö, p < 0.001 for women, å p < 0.05, åå p < 0.01, ååå p < 0.001 for men, obtained by Student’s paired t-test. Data are shown as means. Abbreviations: T-Beer, group that performed HIIT and consumed alcohol beer; T-0.0Beer, the group that performed HIIT and consumed non-alcoholic beer; T-Water, the group that performed HIIT and consumed sparkling water; T-Ethanol, the group that performed HIIT and consumed sparkling water with added alcohol
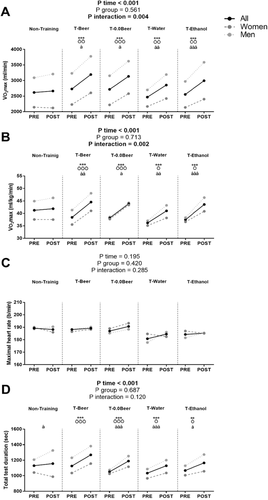
Fig. 3 Changes in total hand grip (a), squat jump (b), counter-movement jump (c), Abalakov jump (d), and drop jump (e) before and after the intervention study. P-value [time, group, and interaction (time x group)] of repeated measure analysis of variance. * p < 0.05; ** p < 0.01 for total sample, ö p < 0.05, for women, å p < 0.05 for men, obtained by Student’s paired t-test. Data are shown as means. Abbreviations: SJ, squat jump; CMJ, counter-movement jump; ABKJ, Abalakov jump; DJ, drop jump; T-Beer, the group that performed HIIT and consumed alcohol beer; T-0.0Beer, the group that performed HIIT and consumed non-alcoholic beer; T-Water, the group that performed HIIT and consumed sparkling water; T-Ethanol, the group that performed HIIT and consumed sparkling water with alcohol added
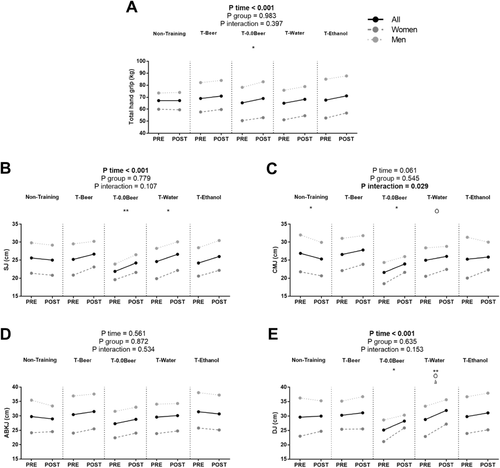
Fig. 4 Changes in maximum oxygen uptake (VO2max.) in absolute (a) and relative terms (b), maximal heart rate (c), and total test duration (d), after the intervention study between the five groups. Significant differences between groups applying an analysis of covariance adjusting for baseline values with post hoc Bonferroni-corrected t-test are indicated as: * p < 0.05 ** p < 0.01, *** p < 0.001. Data are shown as means ± standard error of the mean. Abbreviations: ɳ2, partial eta squared; T-Beer, the group that performed HIIT and consumed alcohol beer; T-0.0Beer, the group that performed HIIT and consumed non-alcoholic beer; T-Water, the group that performed HIIT and consumed sparkling water; T-Ethanol, the group that performed HIIT and consumed sparkling water with alcohol added
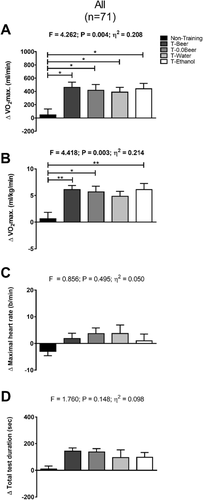
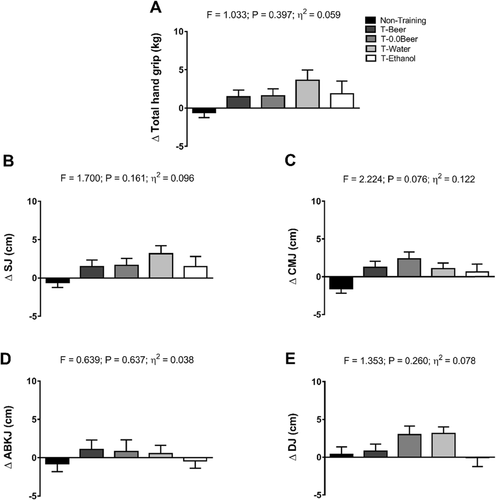
Fig. 5 Changes in total hand grip (a), squat jump (b), counter-movement jump (c), Abalakov jump (d), and drop jump (e), after the intervention study between the five groups. Data are shown as means ± standard error of the mean. Abbreviations: ɳ2, partial eta squared; SJ, squat jump; CMJ, counter-movement jump; ABKJ, Abalakov jump; DJ, drop jump; T-Beer, the group that performed HIIT and consumed alcohol beer; T-0.0Beer, the group that performed HIIT and consumed non-alcoholic beer; T-Water, the group that performed HIIT and consumed sparkling water; T-Ethanol, the group that performed HIIT and consumed sparkling water with alcohol added
rssn_a_12130165_sm0001.docx
Download MS Word (249.7 KB)rssn_a_12130165_sm0002.docx
Download MS Word (275 KB)rssn_a_12130165_sm0003.docx
Download MS Word (17.6 KB)Availability of data and materials
All data generated or analyzed during this study are included in this published article [and its supplementary information files].