
Figures & data
Fig. 1 CONSORT diagram
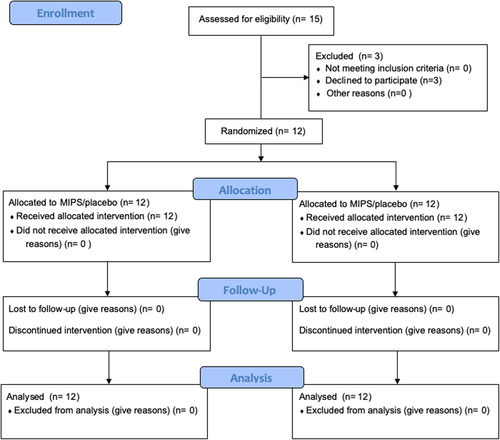
Table 1 Supplement ingredients
Fig. 2 Performance responses in MIPS and Placebo condition. Number of efforts performed (a), time to exhaustion (seconds) (b), time spent above 90% of the V̇O2max (seconds) (c), EPOC 20 min (L) (d) and lactate concentration (mmol/L) at pre, post, post 3, 5 and 7 min (e) in MIPS and Placebo condition. Data are presented as mean ± SD and individual response
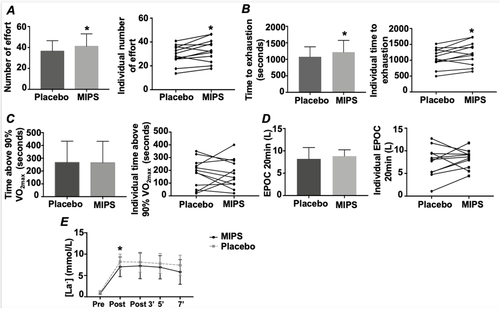
Table 2 Dietary intake and macronutrient distribution 24 h before each trial
Table 3 Energy system contribution for each condition
Availability of data and materials
Data and publication materials can be provided upon request. Please contact corresponding author for this information.