
Figures & data
Table 1 Participant characteristics
Table 2 Heart rate and blood pressure responses
Fig. 1 Blood flow and brachial artery responses to lower and higher doses of GBS. Legend: The effects of lower and higher doses of GBS on brachial artery blood flow (panels a and c, respectively) and brachial artery diameter (panels b and d respectively). All data are presented as means±SD values. Abbreviations: PRE, pre-supplement consumption; PRE2, 45-min post-supplement consumption; POST, within 5 min of arm curl exercise (4 sets of 10 repetitions using 11 kg); 15POST, 15 min post-exercise; 45POST, 45 min post-exercise; Supp, main effect of supplement (GBS versus placebo); Time, main effect of time; SxT, supplement by time interaction
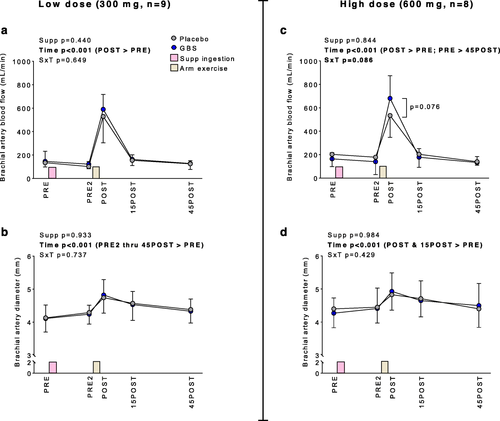
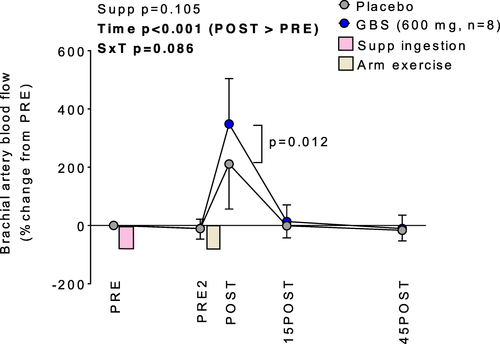
Fig. 2 Blood flow normalized to PRE values during the higher GBS dosage experiment. Legend: The effects of higher doses of GBS on brachial artery blood flow normalized to PRE values. Data are presented as means±SD values. Abbreviations: PRE, pre-supplement consumption; PRE2, 45-min post-supplement consumption; POST, within 5 min of arm curl exercise (4 sets of 10 repetitions using 11 kg); 15POST, 15 min post-exercise; 45POST, 45 min post-exercise; Supp, main effect of supplement (GBS versus placebo); Time, main effect of time; SxT, supplement by time interaction
Additional file 1.
Download MS Excel (238 KB)Availability of data and materials
All raw data are available in Supplemental File 1.