
Figures & data
Fig. 1 Study design and timeline
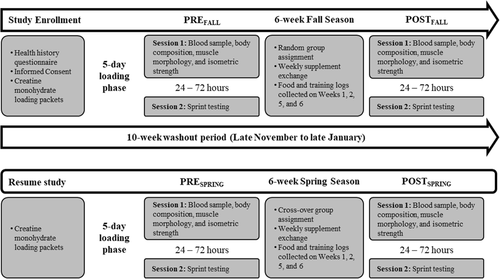
Fig. 2 Changes in circulating concentrations of a) cortisol and b) creatine kinase over the course of the fall and spring rugby seasons. # = Different (p < 0.10) from PREFALL
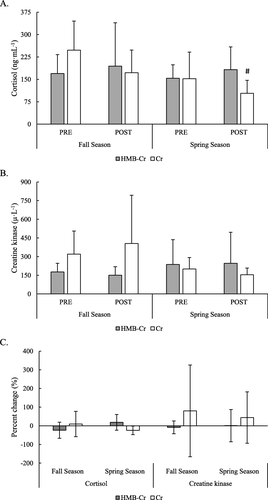
Table 1 Changes in body composition and muscle morphology over the course of the fall and spring rugby seasons
Table 2 Changes in maximal and rapid torque production of the knee extensors and flexors over the course of the fall and spring rugby seasons
Fig. 3 Changes in kinetics during a low-resistance sprint over the course of the fall and spring rugby seasons. * = Significantly (p < 0.05) different from PREFALL; ‡ = Significantly (p < 0.05) different from POSTFALL
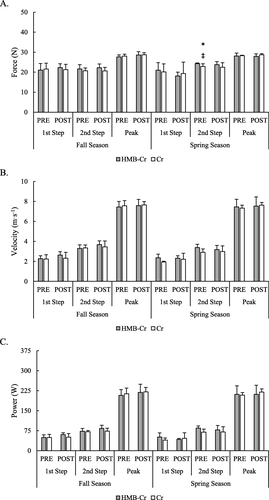
Fig. 4 Changes in kinetics during a high-resistance sprint over the course of the fall and spring rugby seasons
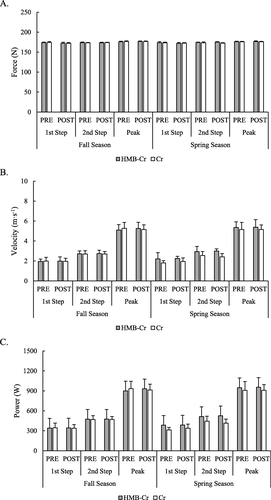
Table 3 Rate of change in kinetics during acceleration phase of 40-m sprint against low- and high-resistance over the course of the fall and spring rugby seasons
Availability of data and materials
The datasets used and/or analyzed during the current study are available from the corresponding author on reasonable request.