
Figures & data
Fig. 1 Aerial view of the accommodations of the race loop (a) and meteorological conditions (b). Open tents were reserved for open athletes (not selected by national teams). The aerial view was extracted from®Google Maps
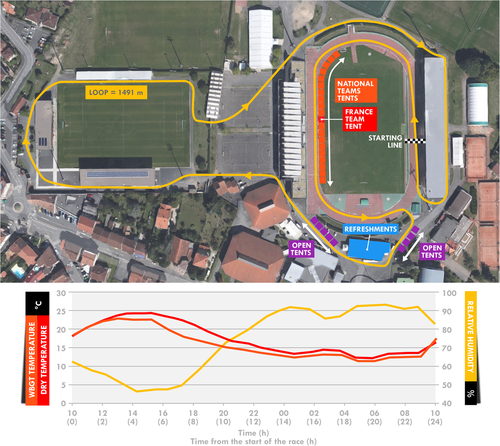
Table 1 Participant characteristics
Table 2 Symptoms declared by the participants during the race
Fig. 2 Mean and individual total intake during the 24-h race. Each numbered colored square refers to a single participant. The grey bar indicates the mean and black brackets define the recommendations [Citation10].
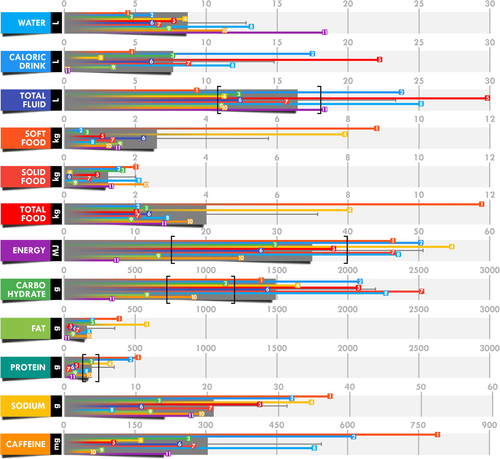
Table 3 Intake and intake rate corrected for body mass
Fig. 3 Dissection of total energy intake using food (a) and macronutrient (b) repartition. Each individual repartition is indicated by colored bars (filled bar, line, and hatched bar) and the mean repartition (x̄) by the grey bar
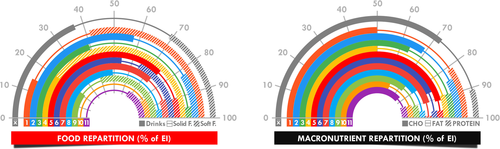
Fig. 4 Correlation between performance (total distance ran) and water and energy intake. Each numbered colored square refers to a single participant
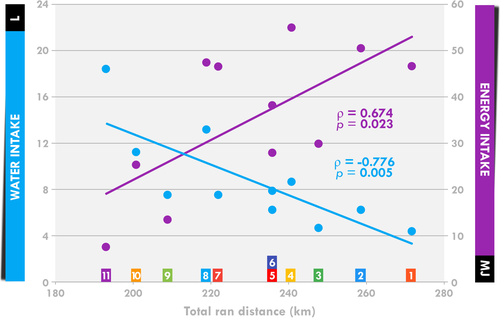
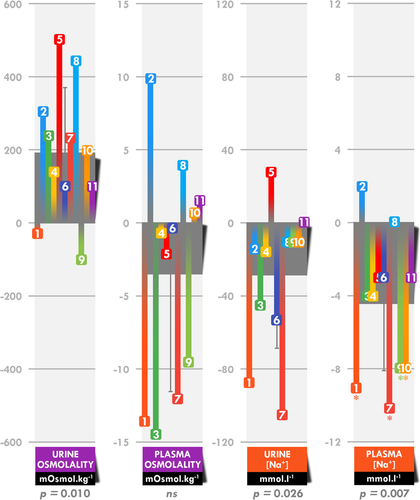
Fig. 5 Absolute modifications in urine and plasma osmolality and sodium concentrations. Each numbered colored square refers to a single participant and the grey bar indicates the mean. *These participants reached the threshold for asymptomatic exercise-associated hyponatremia (135 mmol. L− 1) [Citation36].
Availability of data and materials
The datasets used and/or analysed during the current study are available from the corresponding author on reasonable request.