
Figures & data
Fig. 1 Study Design
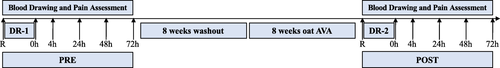
Fig. 2 Plasma CK activity. Data are shown as mean ± SEM. Exercise effect: * P < 0.05 or ** P < 0.01, 0 h/4 h/24 h/48 h/72 h post-DR vs. Rest. Supplementation effect: # P < 0.05 or †P = 0.094, POST vs. PRE regardless of time or AVA treatment. Interaction effect: P < 0.05, time×supplementation
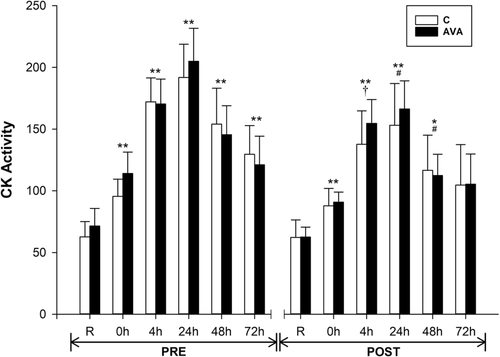
Fig. 3 Neutrophil Respiratory Burst (NRB). Data are shown as mean ± SEM. Exercise effect: * P < 0.05 or ** P < 0.01, 0 h/4 h/24 h/48 h/72 h post-DR vs. Rest. Supplementation effect: # P < 0.05 or ## P < 0.01, POST vs. PRE regardless of time or AVA treatment. Interaction effect: P < 0.05, time×AVA; P = 0.060, supplementation × AVA; P = 0.059, time×supplementation
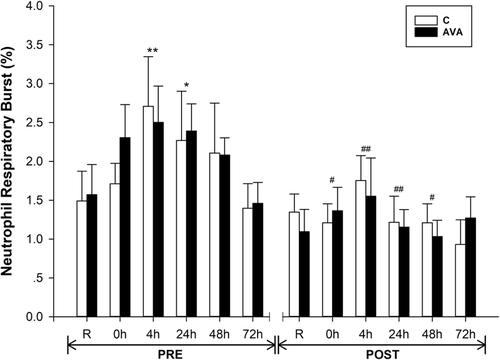
Fig. 4 Plasma G-CSF concentrations. Data are shown as mean ± SEM. Exercise effect: * P < 0.05 or ** P < 0.01, 0 h/4 h/24 h/48 h/72 h post-DR vs. Rest. Supplementation effect: # P = 0.056, POST vs. PRE regardless of time or AVA treatment. Interaction effect: P < 0.05, supplementation×AVA
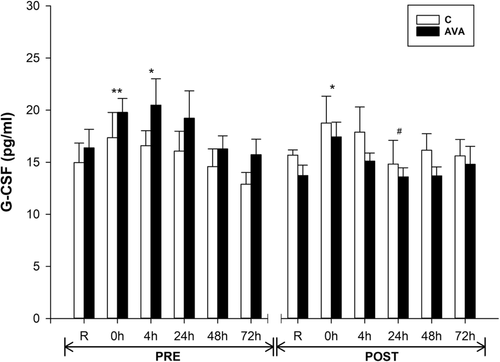
Fig. 5 Plasma IL-6 concentrations. Data are shown as mean ± SEM. Exercise effect: ** P < 0.01, 0 h/4 h/24 h/48 h/72 h post-DR vs. Rest. Interaction effect: P = 0.082, time×AVA
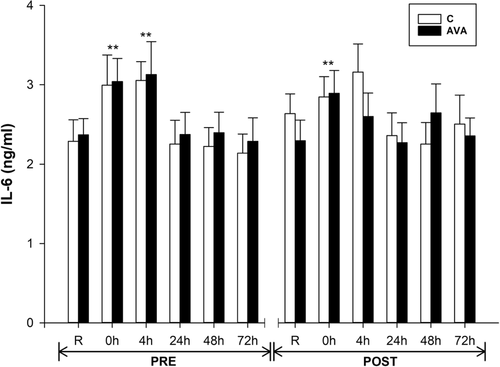
Fig. 6 Plasma IL-1Ra concentrations. Data are shown as mean ± SEM. Exercise effect: * P = 0.069 or ** P < 0.01, 0 h/4 h/24 h/48 h/72 h post-DR vs. Rest. Interaction effect: P < 0.05, time×supplementation×AVA
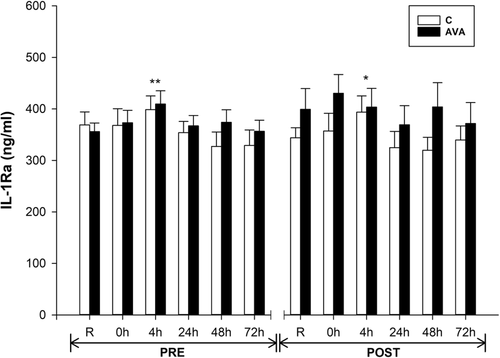
Fig. 7 Plasma sVCAM-1 concentrations. Data are shown as mean ± SEM. Exercise effect: ** P < 0.01, 0 h/4 h/24 h/48 h/72 h post-DR vs. Rest. Supplementation effect: # P = 0.079, POST vs. PRE regardless of time or AVA treatment. Interaction effect: P < 0.05, time×AVA
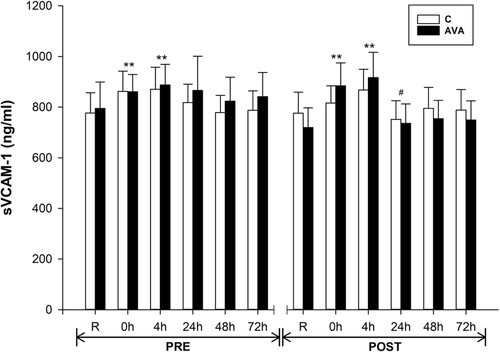
Fig. 8 Plasma MCP-1 concentrations. Data are shown as mean ± SEM. Exercise effect: * P < 0.05 or ** P < 0.01, 0 h/4 h/24 h/48 h/72 h post-DR vs. Rest. Interaction effect: P = 0.064, time×supplementation
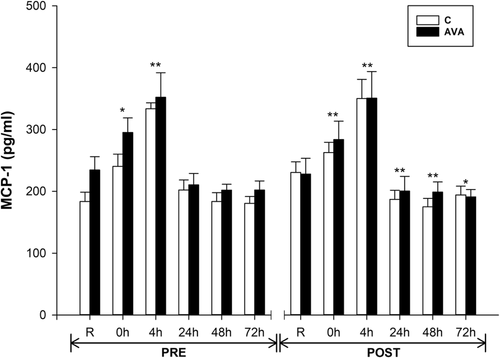
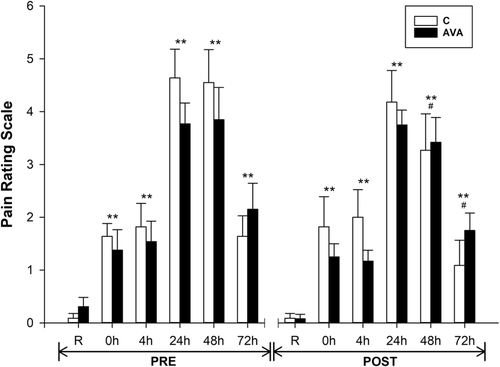
Fig. 9 Pain rating scale. Data are shown as mean ± SEM. Exercise effect: ** P < 0.01, 0 h/4 h/24 h/48 h/72 h post-DR vs. Rest. Supplementation effect: # P < 0.05, POST vs. PRE regardless of time or AVA treatment. Interaction effect: P < 0.05, time×supplementation
Availability of data and materials
The datasets used and/or analyzed during the current study are available from the corresponding author on reasonable request.