
Figures & data
Fig. 1 Testing Session Overview. ASA24: Self-administered dietary recall; BM: Body mass assessment; EE Assessment: Energy expenditure assessment; VAS: Visual analog scale
Table 1 Participant Characteristics
Fig. 2 Metabolism. Changes in resting metabolic rate (RMR; panel a) and respiratory exchange ratio (RER; panel b), assessed via indirect calorimetry, are displayed. For RMR, a significant condition by time interaction was observed using ANOVA with repeated measures. Subsequently, Tukey post-hoc comparisons were performed. Asterisks indicate significant differences between conditions at the specified time point, while E and PL indicate significant differences in the energy drink or placebo conditions, respectively, relative to the pre-beverage value. For RER, a significant main effect for time was observed. T indicates a significant difference from the pre-beverage time point in both groups combined. Error bars indicate the 95% confidence intervals for within-subjects SE due to the repeated-measures design of this study [Citation24, Citation28]
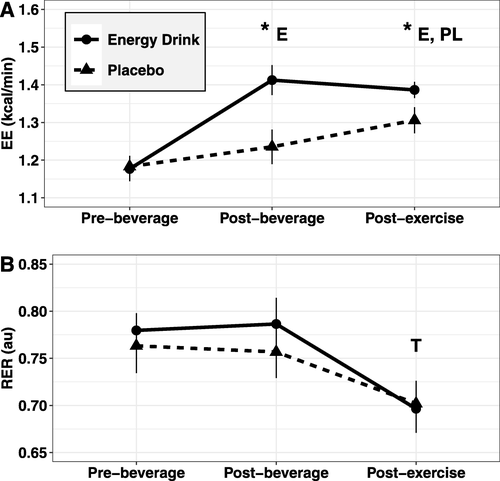
Fig. 3 Squat Performance. Values for isokinetic and isometric performance on the mechanized squat device are displayed, with both time points occurring after beverage ingestion. Pre-RE tests were performed following the second indirect calorimetry assessment and prior to the resistance exercise (RE) testing, while post-RE tests occurred immediately after RE (leg press) testing. Values are displayed for peak concentric force (PFCON; panel a), peak eccentric force (PFECC; panel b), peak isometric force at the 120-degree knee angle (PFISO120; panel c), peak isometric force at the 150-degree knee angle (PFISO150; panel d), peak rate of force development at the 120-degree knee angle (RFD120; panel e), and peak rate of force development at the 150-degree knee angle (RFD150; panel f). Data were analyzed using ANOVA with repeated measures, along with Tukey post-hoc comparisons. A main effect of time was present for PFISO120 (p < 0.001, ηP 2 = 0.65), along with a trend for a main effect of condition (p = 0.07, ηP 2 = 0.19). Additionally, a main effect of time was present for RFD150 (p = 0.028, ηP 2 = 0.28). Error bars indicate the 95% confidence intervals for within-subjects SE due to the repeated-measures design of this study [Citation24, Citation28]
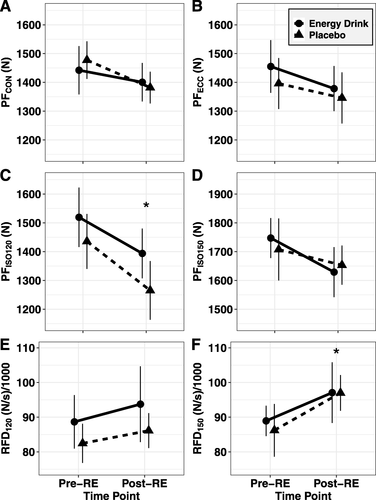
Fig. 4 Leg Press Performance. Paired-samples t-tests were performed to examine group-level differences in leg press 1-repetition maximum (1RM; panel a) and repetitions to failure (panel c). No differences between conditions were observed. Error bars indicate SD, and individual responses are displayed in (panels b and d)
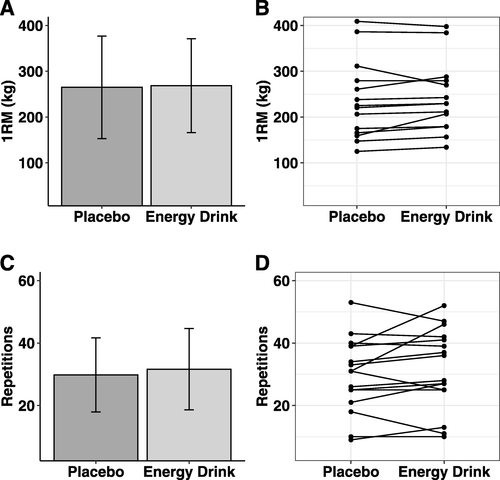
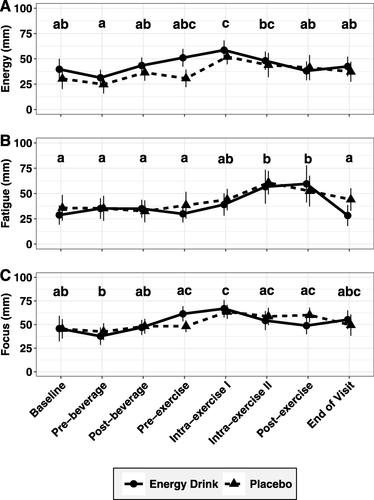
Fig. 5 Subjective Variables. Subject evaluations of energy (a), fatigue (b) and focus (c), evaluated via digital analog scale, are displayed. Data were analyzed via ANOVA with repeated measures, and main effects of time were observed for all three variables. Results of Tukey post-hoc comparisons are displayed, with shared letters indicating no difference between time points. Error bars indicate the 95% confidence intervals for within-subjects SE due to the repeated-measures design of this study [Citation24, Citation28]
Availability of data and materials
The datasets used during the current study are available from the corresponding author upon reasonable request.