
Figures & data
Fig. 1 Flow chart of participants
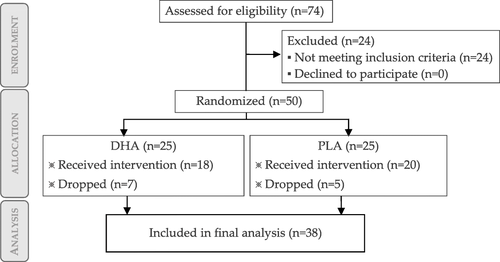
Table 7 Average daily macro-nutrient intake during intervention for both groups
Fig. 2 Change of mean power output (MPO) in Watts (W) at ventilatory threshold 2 (VT2) of the DHA (docosahexaenoic acid) group compared to PLA (placebo) group as relative power (upper graphic) and absolute power (lower graphic). Error bars express 95% of confidence interval. * p<0.05
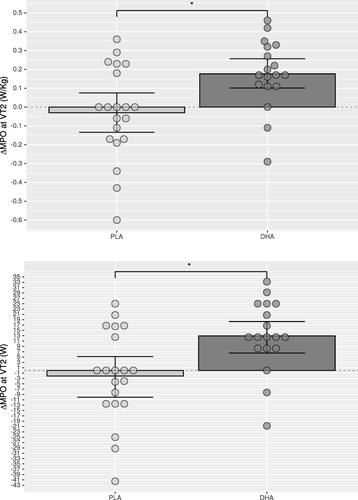
Fig. 3 Change of mean power output (MPO) in Watts (W) at the end of the incremental test to exhaustion (IETE) of the DHA (docosahexaenoic acid) group compared to PLA (placebo) group as relative power (upper graphic) and absolute power (lower graphic). Error bars express 95% of confidence interval. * p<0.05
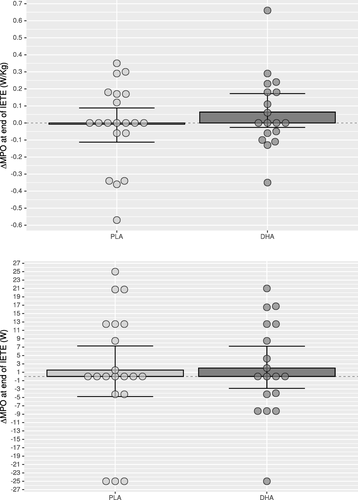
Table 2 Cardiorespiratory data at ventilatory threshold 2
Table 5 Performance data at the end of the IETE
Table 6 Course of cardiorespiratory variables during the recovery phase
Table 1 Cardiorespiratory data at minute 6
Table 3 Cardiorespiratory data at the end of the IETE
Table 4 Performance data at ventilatory threshold 2
Availability of data and materials
The dataset analysed in this study will me made available upon reasonable request.