
Figures & data
Fig. 1 Patients diagram flew. Legend: SE-Experimental group with suboptimal level of vitamin D, SC-Control group with suboptimal level of vitamin D, OE-Experimental group with optimal lever of vitamin D, OC-Control group with optimal level of vitamin D. Plasma levels of vitamin D are shown as means ±SEM in ng/mL
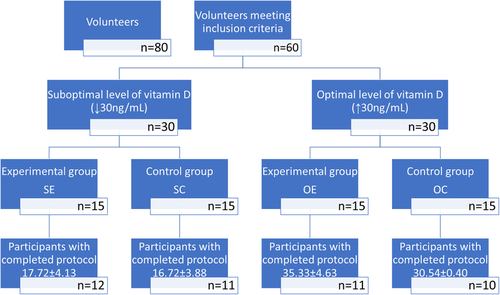
Table 1 Somatic characteristics of study participants
Table 2 Plasma concentration of 25-OH-D [ng/ml] in study participants
Table 3 Interleukin-1β concentration [pg/ml] in study participants
Table 4 Changes of myoglobin [ng/ml] concentration in study participants sera
Table 5 Changes of Lactate dehydrogenase (LDH [mU/ml]) activity levels in plasma of study participants
Table 6 Changes of creatine kinase (CK[mU/ml]) activity in plasma of study participants
Table 7 Changes in calcium (Ca [mg/dl]) and phosphates (P [mg/dl]) levels in blood plasma of study participants
Availability of data and materials
The datasets used and/or analysed during the current study are available from the second author: Bartłomiej Kita ([email protected]) on reasonable request.