
Figures & data
Table 1 Subjects characteristics
Fig. 1 Experimental design. TRE, Time Restricted eating; ND, Normal Diet; GXT, Graded Exercise Testing, PPO, Peak Power Output

Table 2 Diet composition and macronutrients distribution
Fig. 2 Body composition analysis. a total body mass; b fat-free mass and c fat mass. Data are mean ± SD * significantly different form pre values (P < 0.05); # significantly different form TRE value (P < 0.05). TRE, Time Restricted eating; ND, Normal Diet
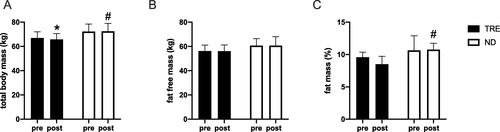
Table 3 Ventilatory measurement during resting, incremental and endurance test
Table 4 Blood biochemestry results
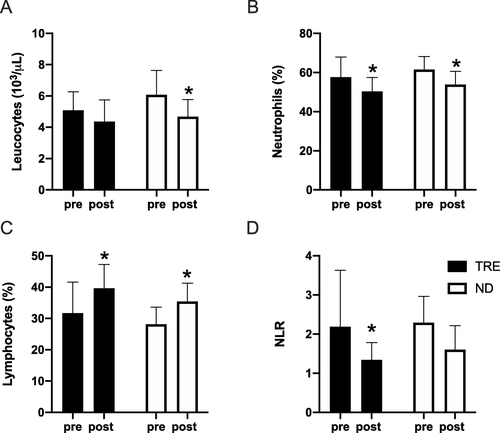
Fig. 3 White blood cells response to 4 weeks of treatment. a White Blood Cells; b Neutrophils; c Lymphocytes and d Neutrophils-to-Lymphocytes ratio (NTR). Data are mean ± SD * significantly different form pre values (P < 0.05). TRE, Time Restricted eating; ND, Normal Diet
Availability of data and materials
The datasets during and/or analysed during the current study available from the corresponding author on reasonable request.