
Figures & data
Fig. 1 Overview of the study design. CFE: citrus flavonoid extract. † Supplementation started after baseline measurements were completed
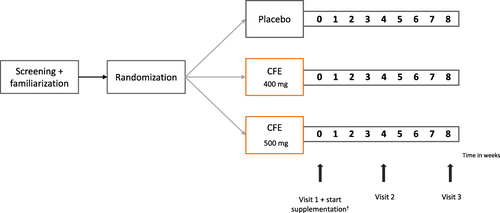
Fig. 2 CONSORT (Consolidated Standards of Reporting Trials) flowchart of the study
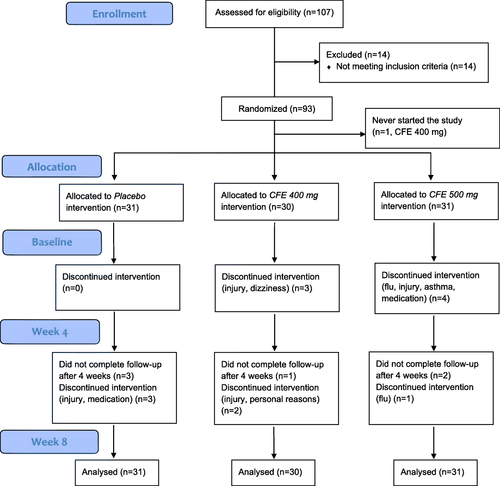
Table 1 Baseline participant characteristics
Table 2 Performance outcomes at baseline and after 4 weeks of supplementation, with corresponding p-values
Fig. 3 Performance outcomes at baseline, after 4 weeks and after 8 weeks of supplementation. Values are presented as observed mean ± SD. Differences between the intervention groups and placebo group were compared with an unstructured linear mixed model with correction for baseline values. * p < 0.05. CFE: Citrus Flavonoid Extract
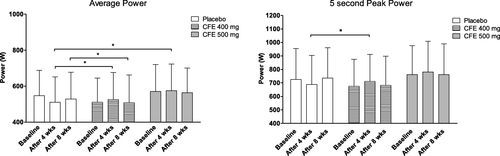
Table 3 Performance outcomes at baseline and after 8 weeks of supplementation, with corresponding p-values
rssn_a_12130210_sm0001.pdf
Download PDF (19.5 KB)Availability of data and materials
The datasets used and/or analyzed during the current study are available from the corresponding author on reasonable request.