
Figures & data
Table 1 Characteristics of subjects
Table 2 Glucose parameters, oxidative stress, and antioxidant capacity of the subjects
Fig. 1 Coenzyme Q10 status (a) Plasma coenzyme Q10; (b) WBC coenzyme Q10. * p < 0.01. WBC, white blood cells
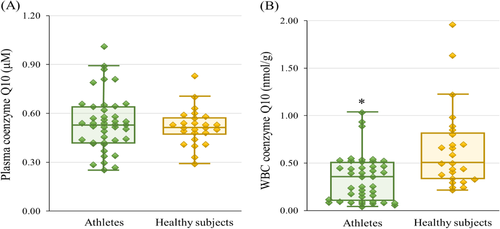
Table 3 Correlations between coenzyme Q10 status and antioxidant capacity in the athletes
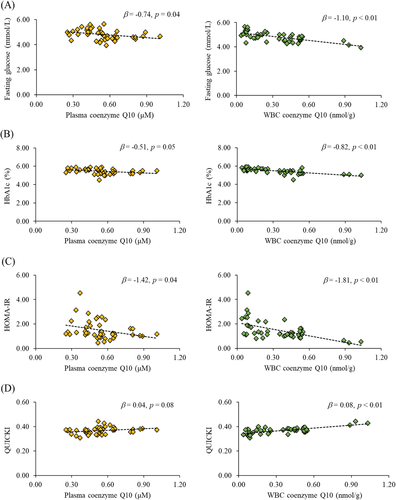
Fig. 2 Correlations between coenzyme Q10 status and glucose parameters in the athletes. a Correlations between coenzyme Q10 status and fasting glucose. b Correlations between coenzyme Q10 status and HbA1C. c Correlations between coenzyme Q10 status and HOMA-IR. d Correlations between coenzyme Q10 status and QUICKI. HbA1C, glycated hemoglobin; HOMA-IR, homeostatic model assessment-insulin resistance; QUICKI, quantitative insulin sensitivity check index
Availability of data and materials
The datasets generated and/or analyzed during the current study are available from the corresponding author on reasonable request.