
Figures & data
Table 1 Composition of Friliver Performance®
Fig. 1 Design of the experimental sessions at 1d and 9w. The experimental sessions were performed in the morning. 1 h after breakfast, participants had their first blood draw immediately before the consumption of SU or PL; after another 1-h interval, a second blood sampling was performed immediately before the beginning of the HIEC (Pre-HIEC). In the course of the HIEC, RPE was repeatedly evaluated as indicated by the arrows. Further blood samples were collected immediately, at 4 and 24 h after the completion of the HIEC
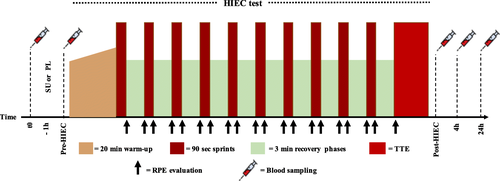
Fig. 2 Structure of training period: nine weeks divided into three mesocycles (three weeks each). The frequency and the duration of the sessions are also indicated. Key: VO2max, maximal oxygen consumption; WLT1 and WLT2, power at lactate thresholds; Wpeak, peak power; HIEC-T, high intensity endurance cycling test
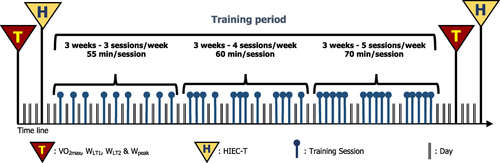
Table 2 Anthropometric, metabolic and biomechanical variables of the participants at baseline; Mean, standard deviations and p values for group are reported
Table 3 VO2max, Wpeak, WLT1 and WLT2*, in SU and PL groups at 1d and 9w
Fig. 3 Perceived exertion rate (RPE) values versus session time; a-b whole RPE time series; c-d RPE values in sprint (SPR) steps at pre-training (1d) and post training (9w) stages, respectively; e-f RPE values in REC steps at 1d and 9w, respectively. Closed circles refer to SU and open circles to the PL group
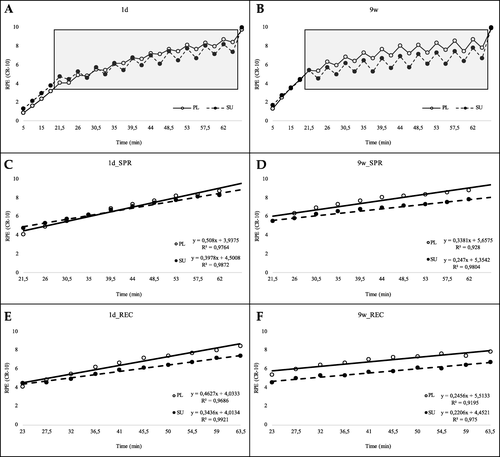
Fig. 4 RPE reduction after the completion of each REC step in the SU and PL groups. The RPE differences are expressed as Delta RPE, which represent the difference between the RPE measured at the end of each SPR and at the end of its subsequent REC step. Delta RPE are plotted against the absolute RPE (on the x-axis) measured at the end of each corresponding SPR step. Panel a and b show 1d and 9 w, respectively
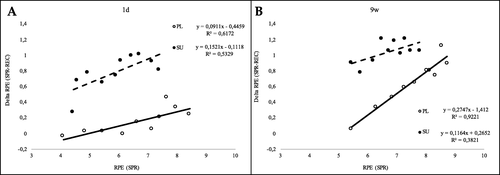
Fig. 5 Difference between the mean RPE scores of SU vs PL groups. Solid bars express the percent RPE differences between the SU and PL groups in the SPR phases and open bars, the percent RPE differences in the REC phases; RPE were measured during the 1d (left) and 9w (right) HIEC sessions. The 1d SPR column was calculated from the data points in Fig. c; 9w SPR, 1d REC and 9w REC columns were calculated from the data points in Fig. d, e and f, respectively
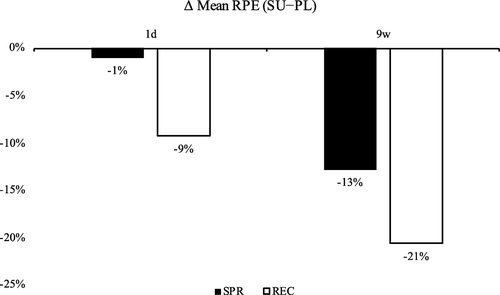
Fig. 6 Training loads in the PL and SU groups as a function of mesocycles and training progression. Bars represent the mean training impulse (TRIMP) associated with the corresponding mesocycle in the PL (white columns) and SU (black columns) groups (standard deviations are reported). Mesocycles and weeks are reported on the x axis. Dashed lines (SU) and solid lines (PL) were obtained using a 5-day moving average. * p < 0.05 as compared to PL; # p < 0.05 as compared to an earlier time point
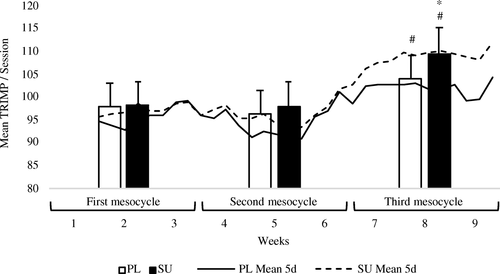
Fig. 7 Creatine kinase (CK) serum blood levels. CK was determined at the indicated time points at 1d (a) and 9w (b) in the SU (black dots) and PL groups (white dots); * p < 0.05 as compared to PL; # p < 0.05 as compared to an earlier time point
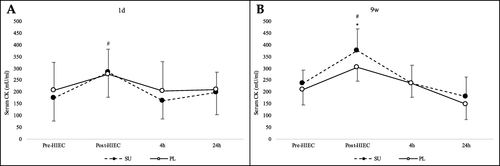
Fig. 8 Branched chain amino acids [BCAA] serum blood levels. [BCAA] (total amount of Leu, Isoleu and Val concentrations) were determined prior to (T0) FP or PL powder ingestion, 1 h after (pre-HIEC) and at the end of the HIEC test (post-HIEC). Panels a and b show analyses performed at 1d and 9w respectively. Values for the SU (black bars) and PL (white bars) groups are reported, with mean and standard deviations. * p < 0.05 per group; # p < 0.05 per time
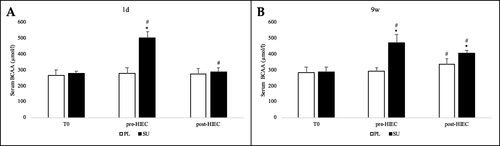
Fig. 9 Total and free Trp plasma concentrations. Trp levels were determined at pre-HIEC and at post-HIEC. Panels a and b show analyses performed at 1d and 9w, respectively. Key: pale grey bars show total Trp in the PL group; dark grey bars, the total Trp in the SU group; white bars, the free Trp in the PL group; black bars, the free Trp in the SU group. Data are reported as means ± standard deviation. # p < 0.05 per time
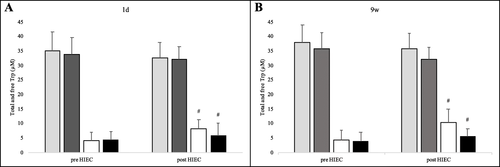
Fig. 10 Free Trp to BCAA ratios. Free Trp and BCAA levels were determined and their ratios were then calculated in both the FP and PL groups. Trp:BCAA ratios before (pre-HIEC) and after HIEC test (post-HIEC) are shown. Panel a shows analyses performed at 1d and panel b those performed at 9w. Values for the SU (black bars) and PL (white bars) groups are reported as means with standard deviations. * p < 0.05 between groups; # p < 0.05 between time points
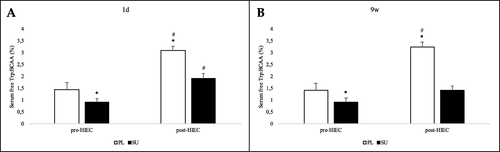
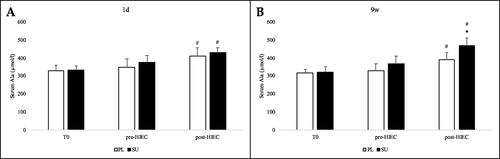
Fig. 11 Ala serum blood levels after SU or PL ingestion and post-HIEC. a and b refer to the beginning (1d) or the end (9w) of the training period, respectively. Values for the SU (black bars) and PL (white bars) groups are reported as means with standard deviations. * p < 0.05 between groups; # p < 0.05 compared to an earlier time point
Availability of data and materials
The datasets used and/or analyzed during the current study are available from the corresponding author upon reasonable request.