
Figures & data
Fig. 1 Overview of study design. On day 1, all meals were provided. At 1900 subjects commenced 10 × 5 min intervals at 82.5% (HIIT) of individual peak power output (PPO) on a customized ergometer bike. L-[ring-13C6-phenylalanine] was initiated during the night. Upon awakening (day 2), blood, muscle and urine samples were collected before commencement of a 90 min steady state ride (55% PPO). Subsequently subjects rested in a supine position for 4 h. Samples were collected as indicated
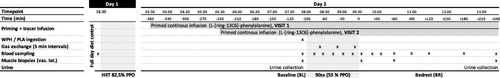
Table 1 Protein beverage content / 100 g
Table 2 Subject characteristics (n = 9)
Fig. 2 Blood parameters. Change in hormone and metabolite levels during BL, 90ss and BR. Insulin (a), cortisol (b), glucose (c), free fatty acids (FFA) (d), 3-hydroxybutyrate (e), urea (f). Data are shown as means ± SD (n = 9); P < 0.05. Means within each trial with different subscripts are significantly different from each other; WPH subscripts are in cursive. # Significant difference between PLA and WPH at each respective timepoint
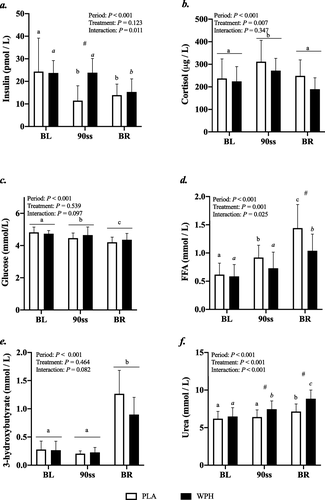
Fig. 3 Arterial concentrations of phenylalanine (a) and leucine (b) at baseline (BL), during 90 steady state exercise (90ss) and during bed rest recovery (BR) with PLA or WPH ingestion. Values are means ± SD (n = 9); P < 0.05. Means within each trial with different subscripts are significantly different from each other; WPH subscripts are in cursive. # Significant difference between PLA and WPH at each respective timepoint
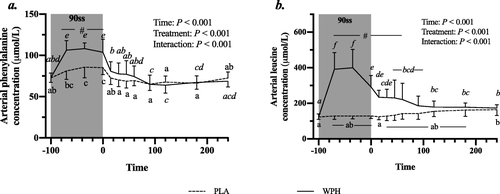
Fig. 4 Arterial phenylalanine enrichment at baseline (BL), during 90 steady state exercise (90ss) and bed rest recovery (BR) with PLA or WPH ingestion. Values are means ± SD (n = 9); P < 0.05. Means within each trial with different subscripts are significantly different from each other; WPH subscripts are in cursive. # Significant difference between PLA and WPH at each respective timepoint
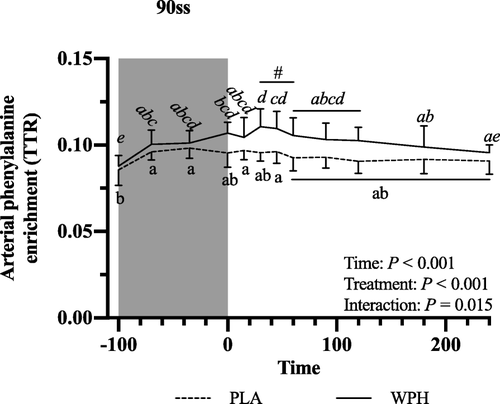
Fig. 5 Forearm plasma flow at baseline (BL), during 90 steady state exercise (90ss) and bed rest recovery (BR) with PLA or WPH ingestion. Values are means ± SD (n = 9); P < 0.05. Means within each trial with different subscripts are significantly different from each other; WPH subscripts are in cursive
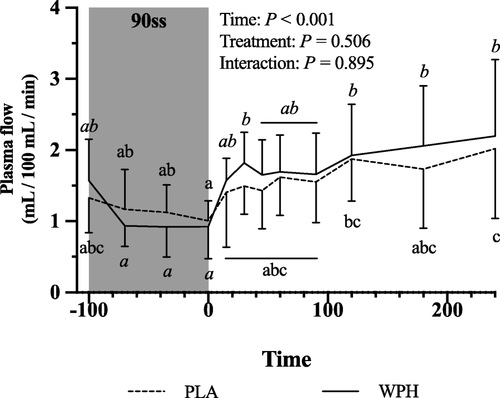
Fig. 6 Forearm net protein balance (a), forearm protein synthesis (b), forearm protein breakdown (c) at baseline (BL), during 90 steady state exercise (90ss) and during bed rest recovery (BR) with PLA or WPH ingestion. Values are means ± SD (n = 9); P < 0.05. Means with different subscripts are significantly different from each other
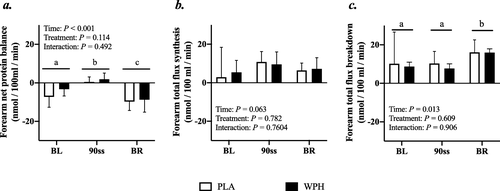
Fig. 7 Muscle protein FSR of the m. vastus lateralis during baseline (BL), 90 min steady state exercise (90ss) and bed rest recovery (BR) with PLA or WPH ingestion. BL FSR’s were performed at Visit 1 regardless of treatment (hatched bars). Values are means ± SD (n = 9); P < 0.05. * Significantly different from BL
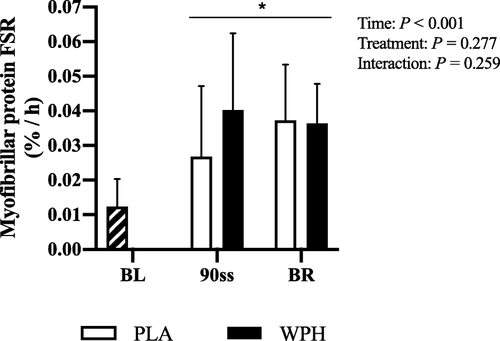
Fig. 8 Protein phosphorylation. Mammalian target of rapamycin (mTOR) (a), ribosomal protein S6 kinase beta-1 (p70S6K) (b), eukaryotic translation initiation factor 4E (EIF4E) (c), tumor protein p53 (p53) (d), p38 mitogen-activated protein kinases (p38MAPK) (e). Western blots representing the time-course effects are presented below the graphs. Based on the applied molecular standards, approximated molecular weights are indicated to the right. n = 9 for all timepoints. Values are normalized to PRE 90ss and are expressed as means ± SD; P < 0.05. * Significantly different from BL. # Significant difference between trials
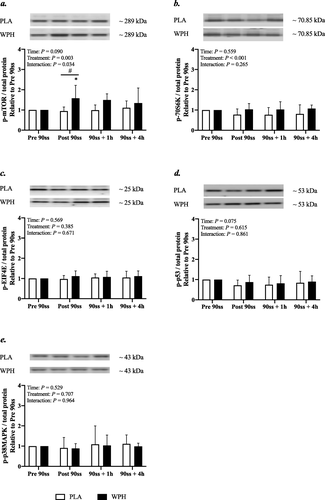
Fig. 9 Gene expression. mRNA expression of peroxisome proliferator-activated receptor gamma coactivator 1-alpha (PGC-1α) (a), mRNA expression of mitochondrial transcription factor A (TFAM) (b), mRNA expression of cytochrome c oxidase subunit IV (COXIV) (c), mRNA expression of carnitine palmitoyl transferase 1B (CPT1B) (d). n = 9 for all timepoints. Values are set relative to PRE 90ss and the fold changes are expressed as means ± SD; P < 0.05. Means within each trial with different subscripts are significantly different from each other. # Significant difference between trials

Additional file 1. Amino acid profile. Beverage amino acid profile and peptide distribution.
Download PDF (65.6 KB)Additional file 2. Calculations. Tracer kinetics calculations.
Download PDF (61.9 KB)Availability of data and materials
The datasets used and/or analyzed during the current study are available from the corresponding author on reasonable request.