
Figures & data
Table 1 General characteristics of Participants
Table 2 Mean and SD for peak power, mean power, fatigue index, and successful kicks in each round at baseline and post-testing for each group
Fig. 1 Mean and SD for absolute total relative peak power change from baseline to post testing. Each dot represents an individual participant. * = significantly different than PLA and CON
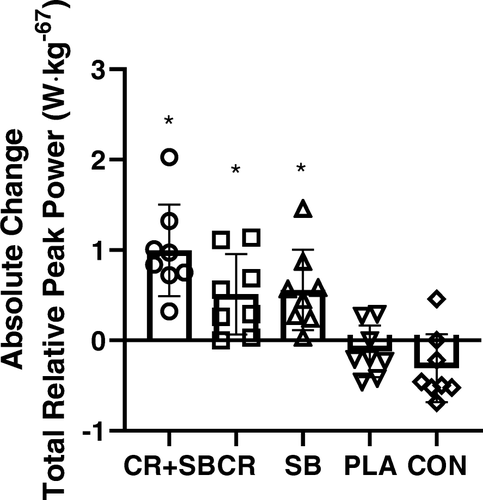
Fig. 2 Mean and SD for absolute total relative MP change from baseline to post testing. Each dot represents an individual participant. * = significantly different than PLA and CON; # = significantly different than CR and SB
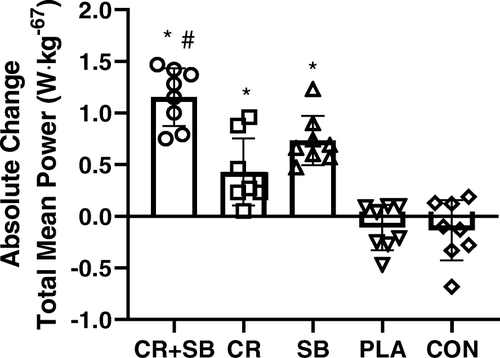
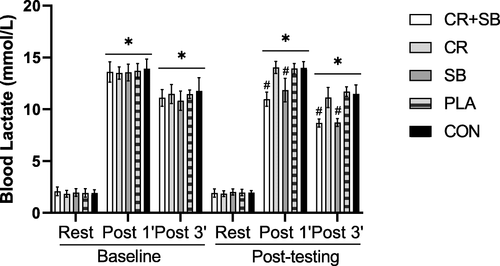
Fig. 3 Mean and SD values of blood lactate in six times of measurements. * = significant increase from rest. # = significantly different than CR, PLA, and CON
Availability of data and materials
Data and publication materials are available from the corresponding author on reasonable request.