
Figures & data
Table 1 Basic characteristics of the study groups
Table 2 Training schedule for the week preceding blood sampling during the first and second examination
Table 3 Changes in 2000 m rowing ergometer performance before and after supplementation
Fig. 1 Relative changes in concentration of IL4, Treg, and Treg/Tδγ between initial states before and after training periods (I-I), between initial and after exertion states (I-E), and between initial and after restitution states (I-R). (I-I) levels of Treg were sustained with an intensive decrease of IL4 (I-I) in the supplemented subgroup, in contrast to an increase of Treg for the placebo subgroup. The post-camp Treg/Tδγ ratio (d = 0.86, p = 0.09) was relatively lower in the supplement subgroup as compared to placebo subgroup
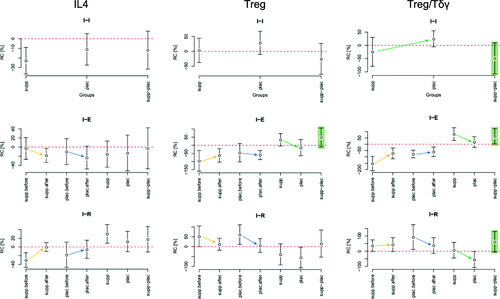
Fig. 2 Relative changes in concentration of CTL, NK, and Tδγ between initial states before and after training period (I-I), between initial and after exertion states (I-E), and between initial and after restitution states (I-R). The before and after camp-training baseline levels of NK were sustained in the supplemented subgroup, in contrast to a decrease of NK for the placebo subgroup. The intensification trend in the supplemental Tδγ increased
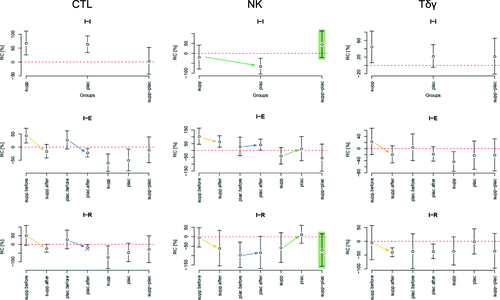
Fig. 3 Relative changes in concentration of IL2, IL10, and IL2/IL10 between initial states before and after training period (I-I), between initial and after exertion states (I-E), and between initial and after restitution states (I-R). The directions of IL2 changes are mutually opposite in the subgroups and at both study points after exertion test (I-E – I-R). The changes in IL2 induced by exertion (I-E) are similar to the changes in IL10 induced by restitution (I-R); the mutual relations of these changes determine the changes in the IL2 / IL10 index. The post-exertion IL2 decrease (d = 1.22, p = 0.02) generates greater IL2/IL10 ratio (d = 1.61, p < 0.01) after recovery
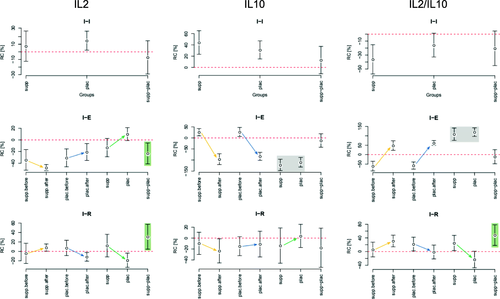
Fig. 4 Relative changes in concentration of IL2 between initial (I-I), exertion (E-E), and restitution (R-R) states before and after training period, with their 95% confidence intervals. In the supplemented subgroup, absolute post-exertion IL2 levels (E-E) remained similar to those before the training, but increased in the control subgroup
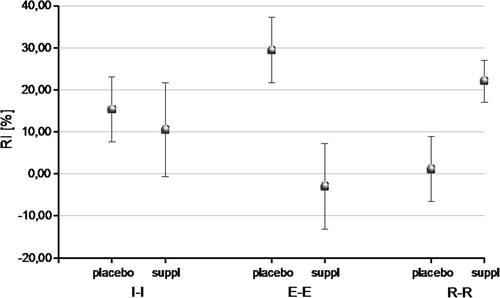
Table 4 Relative changes in concentration of IL-2 in the initial (I-I), post-exertion (E-E), and restitution (R-R) states between before- and after training period
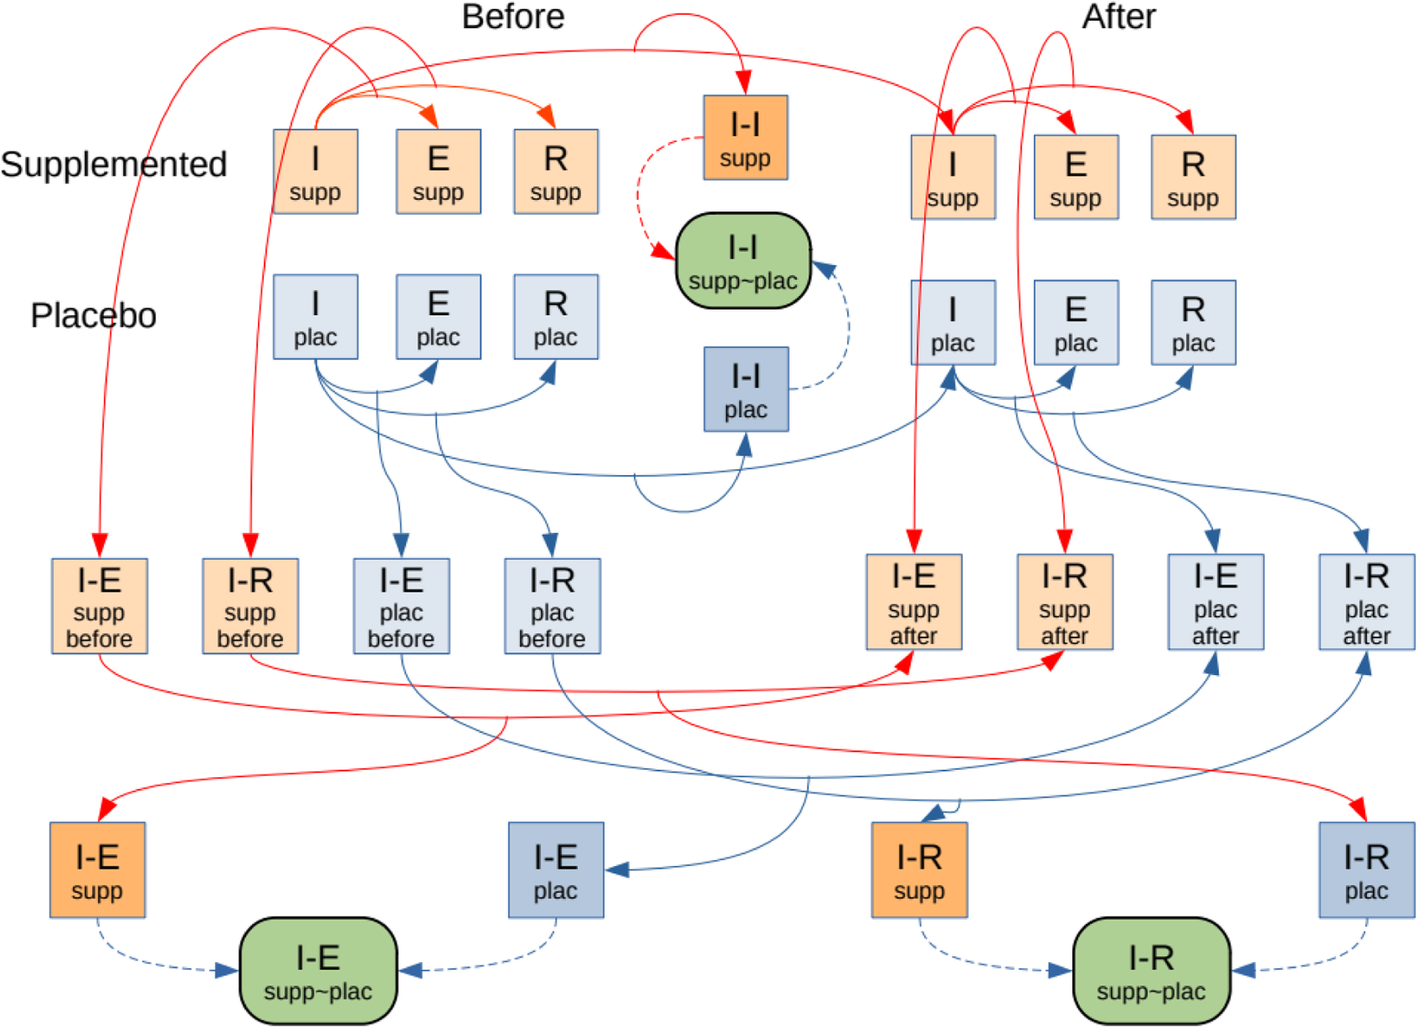
Scheme A1 Diagram of analyses. The figures in the diagram represent: 1) the measurement data sets obtained in the initial state (I), after effort (E) and after restitution (R); 2) the relative changes between them (I-E, I-R) in one measuring session; 3) the relative changes between the 1st and the 2nd measuring session (I-I, I-E, I-R); and 4) the resulting differences between before-after relative changes or values in initial states for the supplemented and the placebo group (green ovals)
Additional file 1.
Download MS Word (196 KB)Availability of data and materials
The datasets during and/or analysed during the current study available from the corresponding author on reasonable request.