
Figures & data
Table 1 Physical characteristics of the study participants (n = 32)
Table 2 Resting values of select biochemical markers in elite gymnast (EG) and physically active man (PAM)
Fig. 1 The relative mean and peak power of anaerobic exercise in elite gymnast (EG) and physically active man (PAM) depending on vitamin D3 levels. White bars with stripes, 25(OH)D3 levels below 22.50 ng/ml; white bars, 25(OH)D3 levels above 22.50 ng/ml; grey bars with stripes, 24,25(OH)2D3 levels below 1.27 ng/ml; grey bars, 24,25(OH)2D3 levels above 1.27 ng/ml; LBT, lower body test; UBT, upper body test
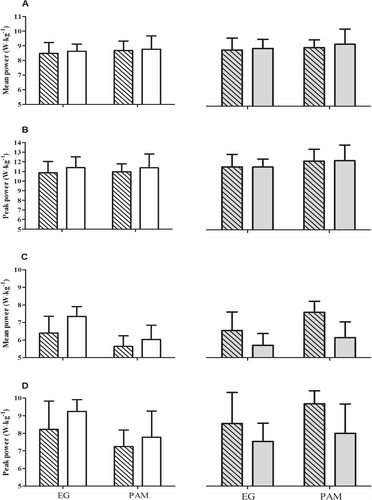
Table 3 Two-way (2 groups × 2 concentrations) ANOVA analysis of the body mass-normalized performance in lower body Wingate test (LBWT) and upper body Wingate test (UBWT)
Fig. 2 Changes in the bone turnover marker levels after Wingate anaerobic test (WAnT) in elite gymnast (EG) and physically active man (PAM) depending on the vitamin D3 levels. CTX, C-terminal telopeptide of type I collagen; PINP, N-terminal propeptide of type I collagen; a and b Lower body Wingate testing; c and d Upper body Wingate testing; I, changes in the peripheral blood 5 min post WAnT; II, changes in the peripheral blood 30 min post WAnT; white bars with stripes, 25(OH)D3 levels below 22.50 ng/ml; white bars, 25(OH)D3 levels above 22.50 ng/ml; grey bars with stripes, 24,25(OH)2D3 levels below 1.27 ng/ml; grey bars, 24,25(OH)2D3 levels above 1.27 ng/ml
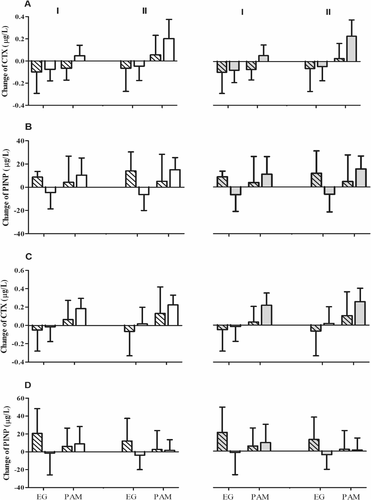
Table 4 Two-way (2 groups × 2 concentrations) ANOVA analysis of the bone turnover marker responses induced by lower body Wingate testing (LBWT) and upper body Wingate testing (UBWT)
Availability of data and materials
(All individual deidentified participant data are available for the next 5 years on reasonable request from the first author)