
Figures & data
Fig. 1 Flow diagram showing the different steps of the systematic review, starting from the literature search to study selection and exclusion
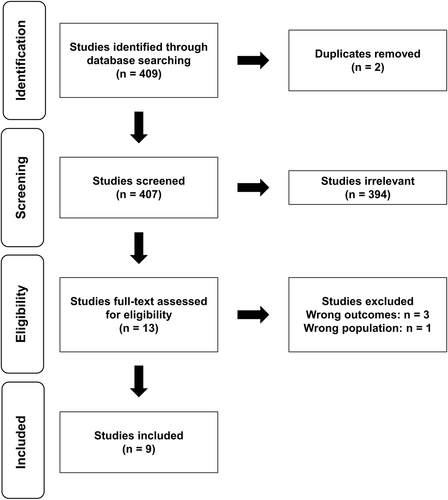
Table 1 Overview of the subjects, strategies, performance changes and PEDro scores of the included studies
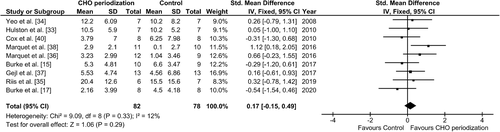
Fig. 2 Forest plot illustrating the effects of endurance training with high (Control) vs. periodized CHO intake on endurance performance in well-trained endurance athletes. “Mean” is the mean relative change in endurance performance and “SD” the variation of these relative changes. “Total” is the number of subjects in each group. The x-axis denotes Cohen’s d (standardized mean difference). The whiskers indicate 95% confidence intervals
Availability of data and materials
Not applicable.