
Figures & data
Fig. 1 Possible mechanisms of effect of nitrate on athletic performance
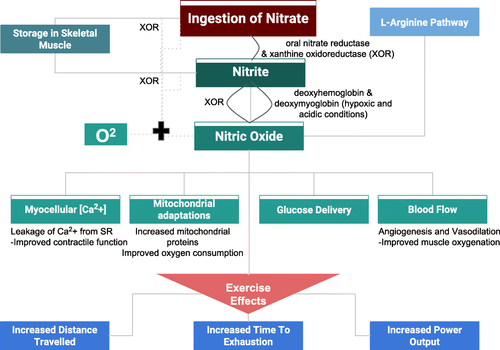
Fig. 2 PRISMA flow diagram for study selection
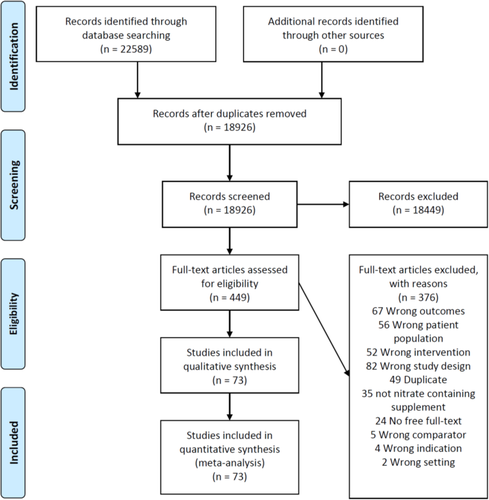
Table 1 Quality of Evidence - GRADE Assessment
Fig. 3 Forest plot for power output in watts for nitrate supplementation versus placebo. Square markers represent mean difference for individual studies, with square size proportional to the weight given to each study in the meta-analysis. Horizontal lines indicate 95% confidence intervals (CI). The solid diamond represents the estimated 95% confidence interval for effect size of all meta-analyzed data
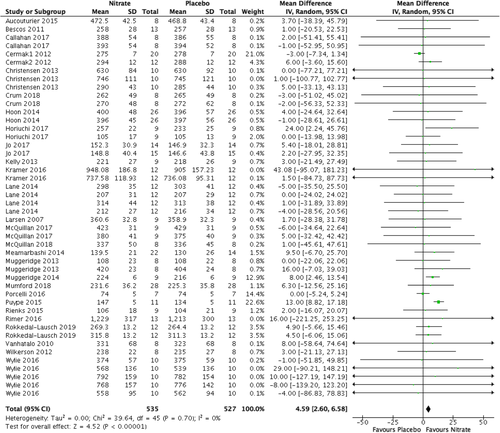
Fig. 4 Forest plot for time to exhaustion in seconds for nitrate supplementation versus placebo. Square markers represent mean difference for individual studies, with square size proportional to the weight given to each study in the meta-analysis. Horizontal lines indicate 95% confidence intervals (CI). The solid diamond represents the estimated 95% confidence interval for effect size of all meta-analyzed data
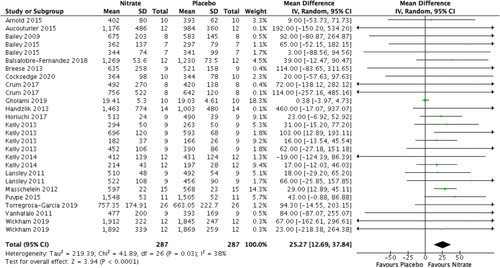
Fig. 5 Forest plot for distance travelled in metres for nitrate supplementation versus placebo. Square markers represent mean difference for individual studies, with square size proportional to the weight given to each study in the meta-analysis. Horizontal lines indicate 95% confidence intervals (CI). The solid diamond represents the estimated 95% confidence interval for effect size of all meta-analyzed data
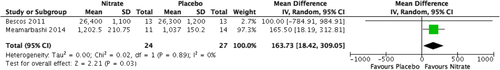
Fig. 6 Forest plot for VO2 in litres/minute for nitrate supplementation versus placebo. Square markers represent mean difference for individual studies, with square size proportional to the weight given to each study in the meta-analysis. Horizontal lines indicate 95% confidence intervals (CI). The solid diamond represents the estimated 95% confidence interval for effect size of all meta-analyzed data
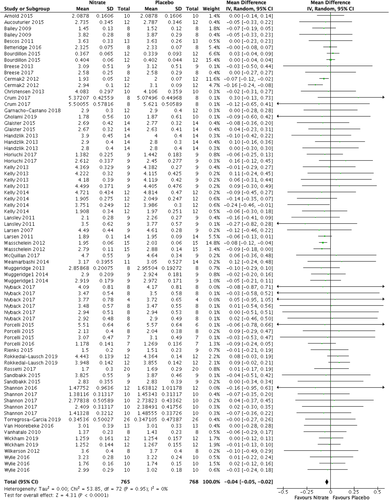
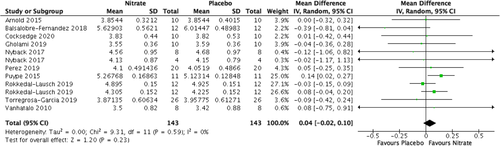
Fig. 7 Forest plot for VO2max in litres/minute in kilojoules for nitrate supplementation versus placebo. Square markers represent mean difference for individual studies, with square size proportional to the weight given to each study in the meta-analysis. Horizontal lines indicate 95% confidence intervals (CI). The solid diamond represents the estimated 95% confidence interval for effect size of all meta-analyzed data
rssn_a_12130259_sm0001.docx
Download MS Word (15 MB)Additional file 2: Supplementary Table 1. Search strategies and search terms used with various databases.
Download MS Word (164.6 KB)Additional file 3: Supplemental Table 2. Study Characteristics of Included Randomized Controlled Trials
Download MS Word (100.9 KB)Availability of data and materials
The authors will consider written requests for data.