
Figures & data
Table 1 Participant characteristics
Fig. 1 Experimental design
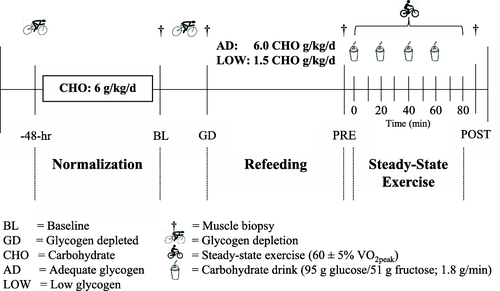
Table 2 Muscle glycogen and substrate oxidation.
Adapted from Margolis et al. [Citation12]
Fig. 2 Fold change before (PRE) and after (POST) steady-state for p-AMPKThr172 (A), p-AKTThr473 (B), p-mTORSer2448 (C), p-p70S6KThr424/421 (D), and p-rpS6Ser235/236 (E) relative to baseline (BL) values (dotted line) for low (LOW; circle) or adequate (AD; black square) glycogen status. Values are mean ± SD, n = 11. *Different than BL, P < 0.05. ‡Different than PRE, P < 0.05. +Different than AD, P < 0.05
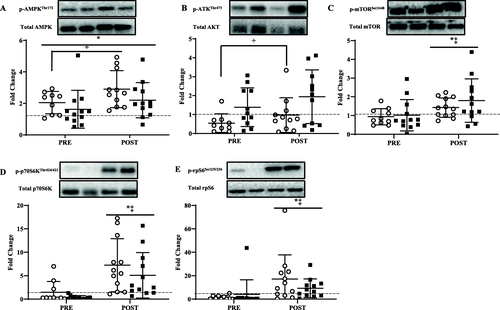
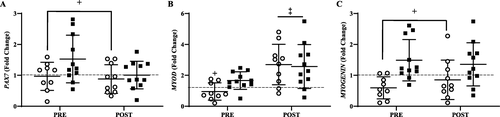
Fig. 3 Fold change before (PRE) and after (POST) steady-state for PAX7 (A), MYOD (B), and MYOGENIN (C) relative to baseline (BL) values (dotted line) for low (LOW; circle) or adequate (AD; black square) glycogen status. Values are mean ± SD, n = 11. *Different than BL, P < 0.05. ‡Different than PRE, P < 0.05. +Different than AD, P < 0.05
Availability of data and materials
All extracted data are presented in this manuscript. The corresponding author may be contacted for any data requests or questions.