
Figures & data
Fig. 1 Enrollment and categorization of participants. Race distances: 10 km – 10-kilometers, HM – half-marathon, M/UM – marathon/ultra-marathon.
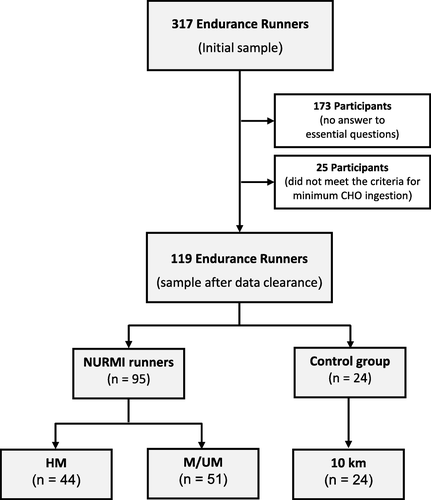
Table 1 Anthropometric and sociodemographic characteristics of participants
Table 2 Prevalence of most frequently used micronutrient supplements
Fig. 2 Effect plots with 95 % CI for interactions between sex, age, race distance, running experience, racing experience and supplement intake from carbohydrates/protein (a), vitamins (b), and minerals (c). CHO – carbohydrates. 10 km – 10-kilometers. HM – half-marathon. M /UM – marathon/ultra-marathon
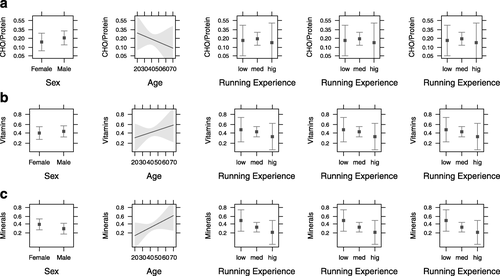
Table 3 Effects of sex, age, race distance, running experience and racing experience on supplement intake
Availability of data and materials
The datasets generated during and/or analyzed during the current study are not publicly available, but may be made available upon reasonable request. Subjects will receive a brief summary of the results of the NURMI Study if desired.