52
Views
0
CrossRef citations to date
0
Altmetric
Research

Pharmaceutical company spending on research and development and promotion in Canada, 2013-2016: a cohort analysis

ORCID Icon
Article: 5 | Received 05 Dec 2017, Accepted 19 Feb 2018, Published online: 28 Nov 2023

Figures & data

Table 1 Spending on R&Da and promotion as a percent of sales industry-wide

Table 2 Number of 50 most promoted drugs per company per year

Table 3 Spending on R&Da and promotion as a percent of sales for companies with the most heavily promoted drugs

Fig. 1 Percent of sales spend on R&D* and promotion by number of companies. *Research and development

Fig. 1 Percent of sales spend on R&D* and promotion by number of companies. *Research and development

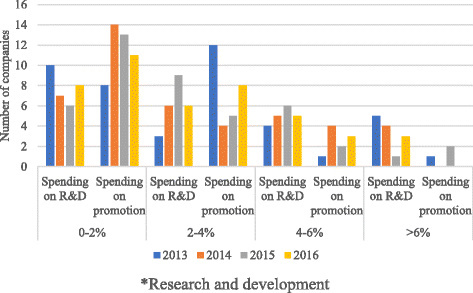
Table 4 Variation in promotion and research and development spending by individual company by year

Supplemental material

Additional file 1: Table S1.

Download MS Excel (10.2 KB)

Additional file 2: Table S2.

Download MS Excel (10.1 KB)

Additional file 3: Table S3.

Download MS Excel (9.8 KB)

Additional file 4: Table S4.

Download MS Excel (10 KB)