Figures & data
Fig. 1 Seven-step process for developing the MCDA tool in a workshop with key decision makers in Kuwait
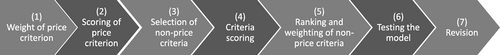
Table 1 Results of the consensus workshop for the relative importance of the evaluation criteria and their weight in the final score for each option. *The initially determined weights were refined after the case study experience by reducing the weight of the price criterion. ** Health economic or health outcomes data
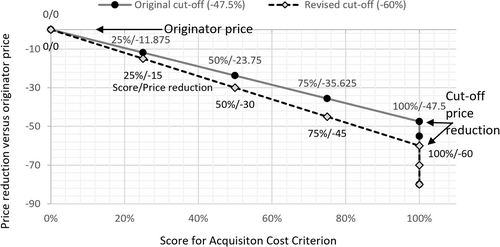
Fig. 2 Graphic representation of the scoring for the price reduction of the alternatives versus the originator price. The original cut-off point determined in the workshop was − 47.5% meaning that all drugs offered at 52.5% of the originator price or below would receive a full score for the price criterion. The cut-off point was revised after the case study exercise to − 60%. Now, all prices at or below 40% of the originator price receive the full score. The scores between the originator price (Score = 0) and the full score follow a linear function