
Figures & data
Table 1 Socio-demographic characteristics of pharmacy professional assessed for job satisfaction in public hospitals in Eastern Ethiopia, 2017 (n = 220)
Table 2 Pharmacy professionals’ characteristics assessed for job satisfaction in public hospitals in Eastern Ethiopia, 2018 (n = 220)
Table 3 Proportions of pharmacy professionals’ response to job satisfaction questions in Easter Ethiopia, 2018 (n = 220)
Fig. 1 Level of overall job satisfaction and satisfaction on working environment, interpersonal relations, and incentive and recognition, among Pharmacy professionals in Easter Ethiopia, 2018 (n = 220)
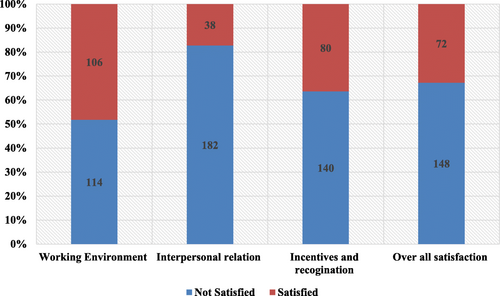
Table 4 Determinants of job satisfaction among pharmacy professionals in Easter Ethiopia, 2018 (n = 220)
Availability of data and materials
The data collection tools are attached as an additional supporting file. The datasets are available from the corresponding author on reasonable request.