
Figures & data
Table 1 Specifying the target behavior
Fig. 1 The behavior change wheel. Used with a permission from [Citation28]
![Fig. 1 The behavior change wheel. Used with a permission from [Citation28]](/cms/asset/e5ed908b-5482-47b2-8704-d3750cb96ee4/jppp_a_12315163_f0001.png)
Fig. 2 Screenshot shows searching for captopril-related recommendations on Plus65 Med©

Table 2 Characteristics of the study population (N: 480)
Fig. 3 Distribution of PIMs among the two groups
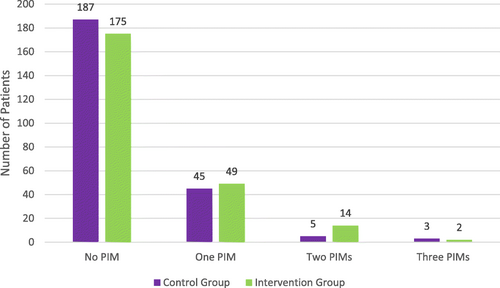
Table 3 Comparison of prevalence rates of PIM among the control and intervention groups
Fig. 4 Distribution of PPOs among the study group
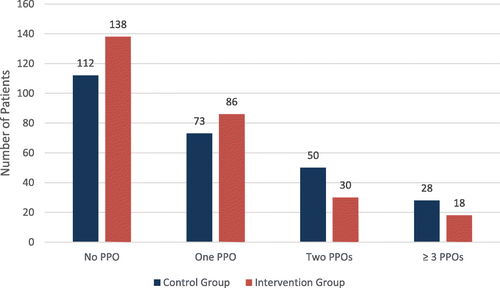
Table 4 Comparison of the prevalence rate of PPO among the control and intervention groups
Availability of data and materials
The datasets used and/or analyzed during the current study are available from the corresponding author on reasonable request.