
Figures & data
Table 1 Average percentage point change in AMU measures: individually and by category and level of care
Table 2 Predictors associated with AMU measures scored as yes/no at each facility in multivariate logistic models
Table 3 Predictors associated AMU measures scored as percentages in multivariate hierarchical logistic models
Table 4 Predictors associated with dispensing and prescribing measures scored as percentages in multivariate hierarchical logistic models
Fig. 1 Changes in 24 dispensing measures from initial visit to last visit by level of care
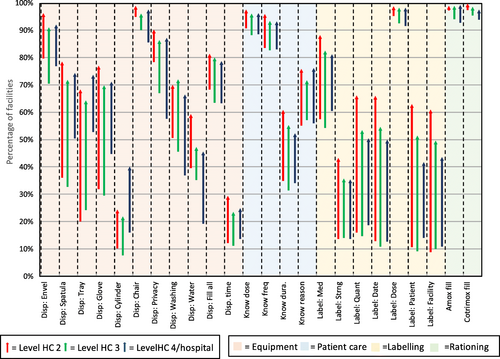
Fig. 2 Changes in 32 prescribing measures from initial visit to last visit by level of care
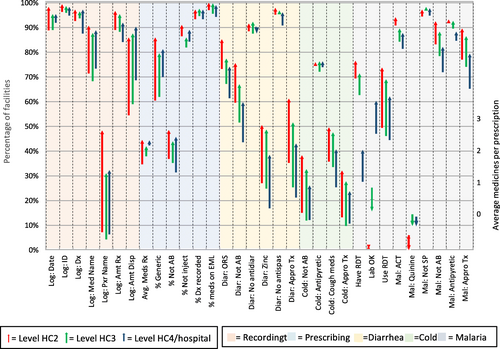
Fig. 3 Average scores for 55 AMU percentage measures at first and last visit (n = 1222)
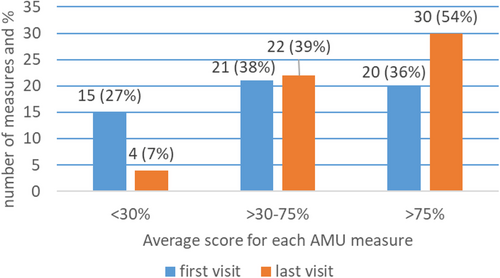
Fig. 4 Average scores across all AMU measures at first and last visit for 1222 facilities
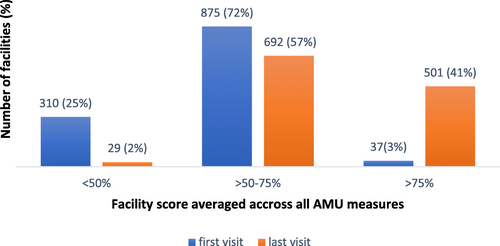
Table 5 Predictors associated with AMU treatment measures scored as percentages in multivariate hierarchical logistic models
Additional file 1.
Download PDF (379.7 KB)Additional file 2.
Download PDF (148.1 KB)Additional file 3.
Download PDF (184.2 KB)Additional file 4.
Download PDF (179.5 KB)Additional file 5.
Download PDF (138.4 KB)Availability of data and materials
The data, data collection tool, interviews, analysis, and other materials are provided either in supplementary files or can be obtained from the corresponding author.