
Figures & data
Table 1 The characteristics of the study participants (storekeepers) and public hospitals in Jimma zone, April 30 to May 29, 2019 (n = 7)
Table 2 Availability and utilization of LMIS tools per facility in selected public hospitals in Jimma zone, April 30 to May 29, 2019 (n = 7)
Fig. 1 Bin-card use and updating practices in selected public hospitals in Jimma zone, April 30 to May 29, 2019
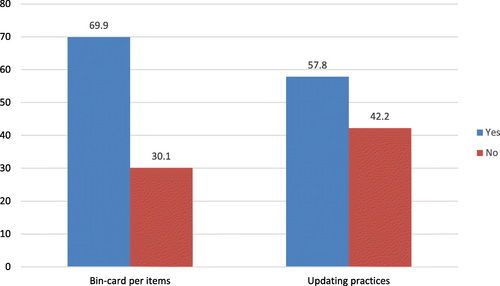
Fig. 2 Frequency of physical counts for laboratory commodities in selected hospitals in Jimma zone, April 30 to May 29, 2019
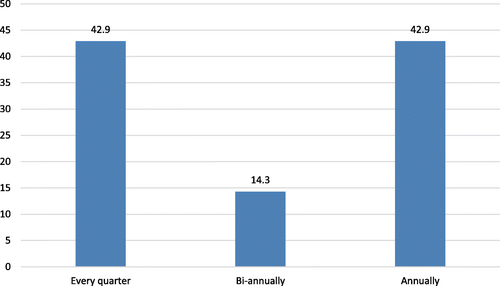
Fig. 3 Inventory accuracy rate for laboratory commodities in selected hospitals in Jimma zone, April 30 to May 29, 2019
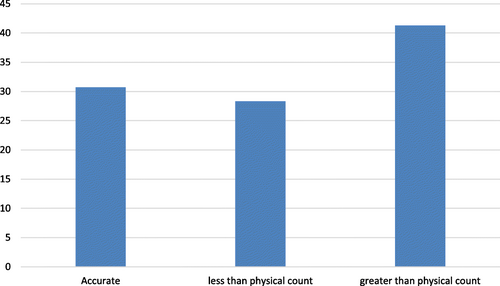
Table 3 Ordering and receiving processes of laboratory commodities in selected public hospitals in Jimma zone, April 30 to May 29, 2019 (n = 7)
Table 4 Storage conditions for laboratory commodities in selected hospitals in Jimma zone, April 30 to May 29, 2019 (n = 7)
Table 5 Wastage rates and value of unused laboratory commodities in selected hospitals in Jimma zone, April 30 to May 29, 2019
Additional file 1. The descriptions, formula, interpretation, and data sources of the main indicators/variables used in the current study.
Download MS Word (25.9 KB)Additional file 2.
Download MS Word (27.3 KB)Availability of data and materials
The data sets generated during and/or analyzed during the current study are available from the corresponding author on reasonable request.