
Figures & data
Fig. 1 Universal Health Coverage at a Glance Source: WHO Regional Office for Africa, 2017
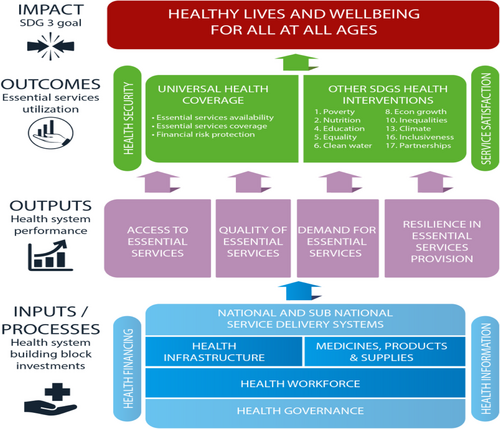
Fig. 2 WHO five-step capacity-building model for the National Regulatory Authorities. Source: [Citation11]
![Fig. 2 WHO five-step capacity-building model for the National Regulatory Authorities. Source: [Citation11]](/cms/asset/64892c38-b590-452e-8e59-243984549baf/jppp_a_12315188_f0002.png)
Fig. 3 Number of countries according to the type of NMRA Governance Structure, countries within SADC (N = 12), 2017
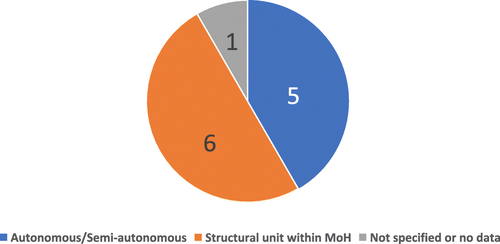
Fig. 4 Number of countries according to the scope of Medical Product Regulation, by type of Medical Product, Countries within SADC (N = 12), 2017
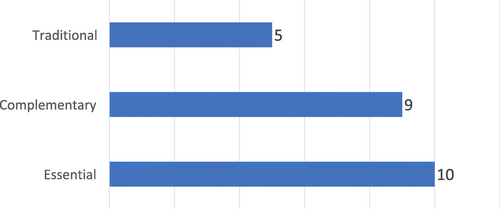
Fig. 5 Number of countries according to the scope of biologicals regulation, by type of biological product, countries within SADC (N = 12), 2017
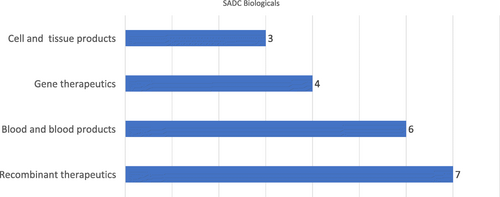
Fig. 6 Select product types included in the definition of medicines
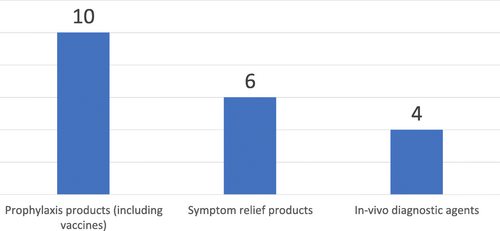
Fig. 7 Regulatory functions throughout medicine life-cycle
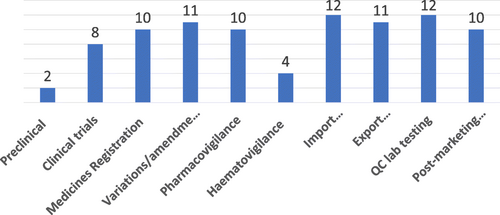
Fig. 8 Lifecycle regulation of medical devices
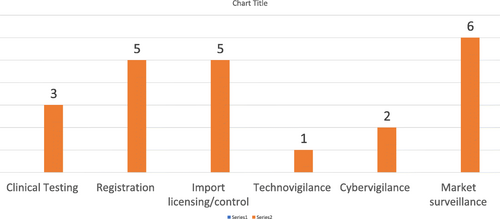
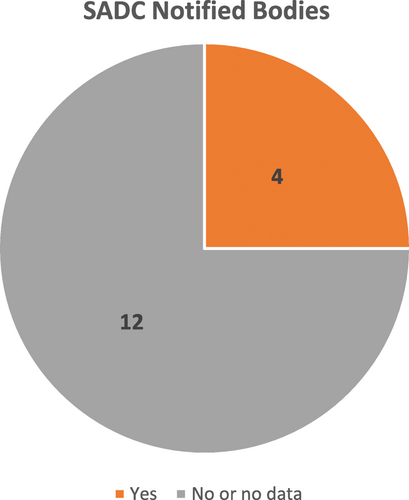
Fig. 9 Notified bodies
Availability of data and materials
The datasets used and analysed during the study that are the main basis for the review are available from the corresponding author on request.