
Figures & data
Table 1 Overall procurement cost of analgesics in 793 public hospitals from 2013 to 2018
Fig. 1 Annual cost and proportion of NSAIDs and opioids from 2013 to 2018 (100 million CNY, %)
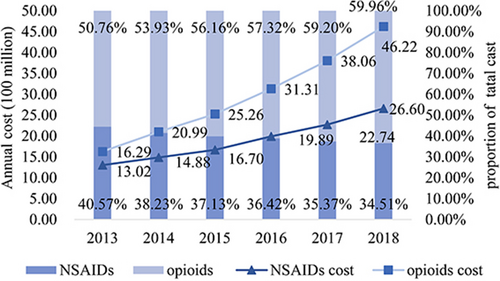
Fig. 2 Total cost of main opioids drugs from 2013 to 2018 (100 million CNY)
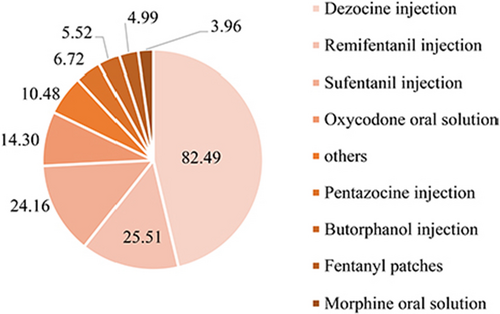
Fig. 3 Annual cost of the four main opioid drugs from 2013 to 2018 (100 million CNY)
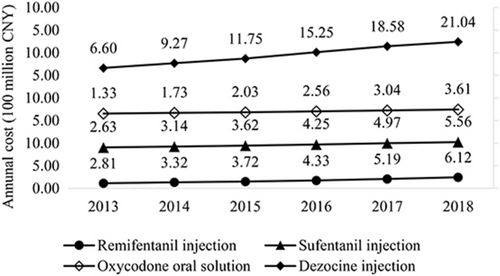
Fig. 4 Proportion of four major opioids drugs from 2013 to 2018
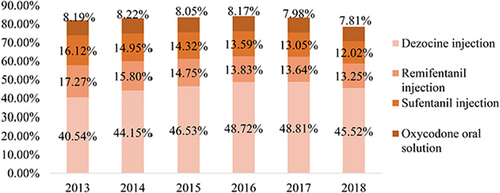
Table 2 Total cost and proportion of main NSAIDs drugs from 2013 to 2018 (billion CNY, %)
Fig. 5 Annual cost of main NSAIDs drugs from 2013 to 2018 (100 million CNY)
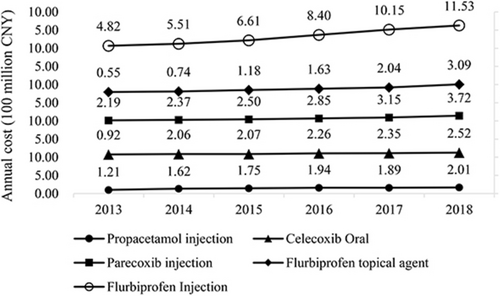
Fig. 6 Proportion of major NSAIDs drugs from 2013 to 2018
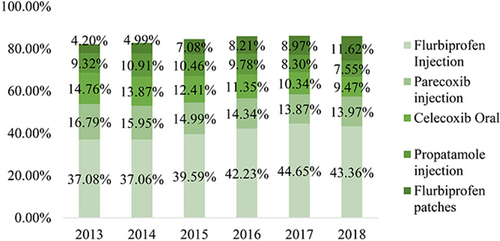
Fig. 7 Total clinical dosage utilization of analgesics from 2013 to 2018 (100 million, DDD)
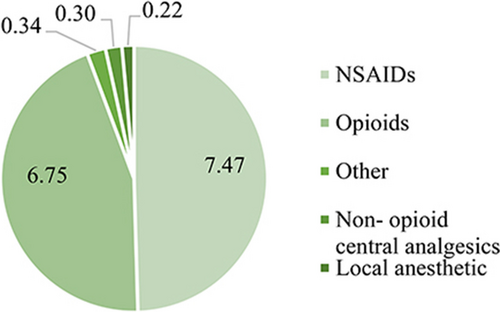
Table 3 Annual dosage and proportion of opioids and NSAIDs from 2013 to 2018
Fig. 8 DDI of NSAIDs from 2013 to 2018
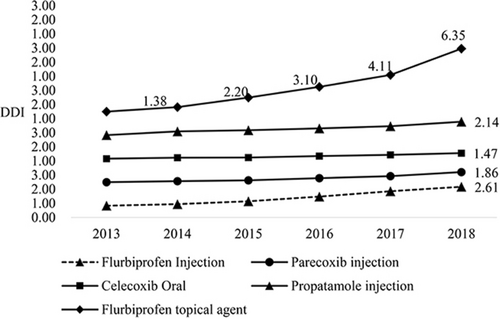
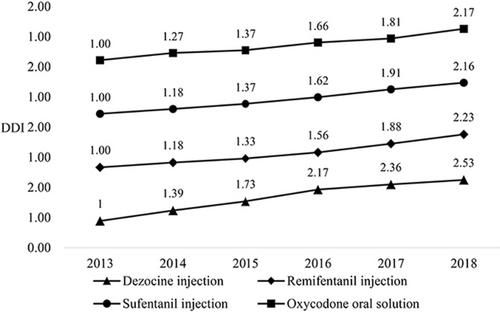
Fig. 9 DDI of opioids from 2013 to 2018
Availability of data and materials
The data used to support the findings of this study are available from the corresponding author upon reasonable request.