
Figures & data
Table 1 Socio-demographics of respondents
Table 2 Distribution of pharmacists’ confidence level according to type of anticoagulants
Fig. 1 Distribution of responses (n = 542) according to their confidence level in different aspects of anticoagulation therapy
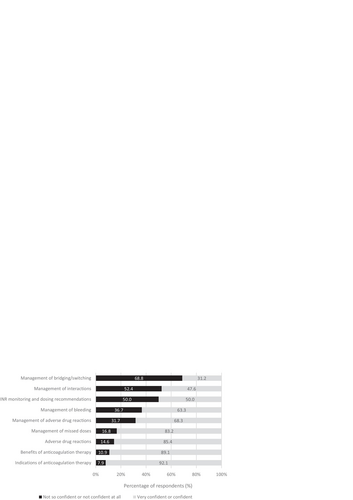
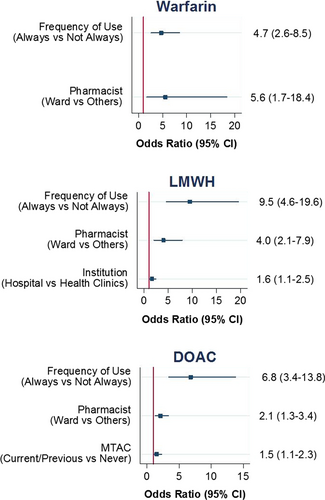
Fig. 2 Socio-demographics that associated with pharmacists’ confidence in warfarin, LMWHs, DOACs; no multicollinearity and interaction detected. Hosmer–Lemeshow test, (p > 0.05 for all), classification table (overall correctly classified percentage = 88.54%, 66.2%, 67.16%), area under the ROC curve (71.09%, 73.4%, 64.63%), AIC value (351.5, 623.6, 682.03), BIC value (364.36, 640.8, 699.21) and pseudo R 2 (0.1032, 0.1632, 0.069) were applied to check the model fit
Additional file 1.
Download MS Word (54.4 KB)Availability of data and materials
The datasets used and/or analysed during the current study are available from the corresponding author on reasonable request.