
Figures & data
Fig. 1 Comparison of research questions and assumptions between the three proposed PDC measures
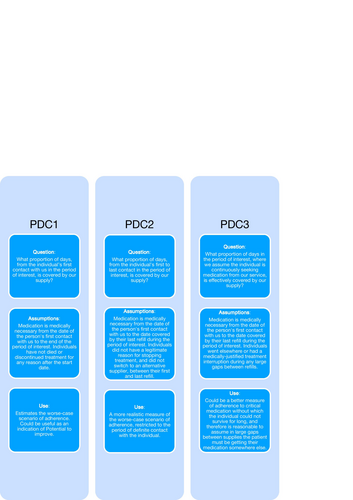
Fig. 2 Graphical representation of two patterns of prescription medication supply and calculation of PDC under different follow-up lengths. Period of interest is defined between January 1st and April 30th
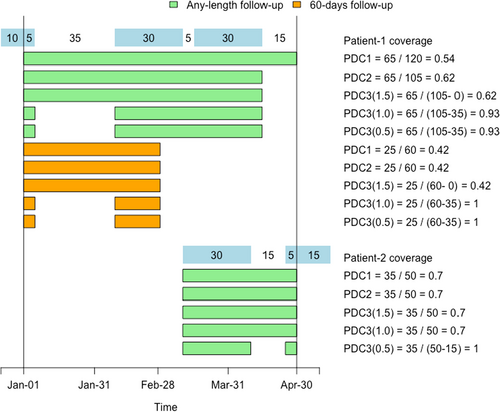
Table 1 Sample characteristics
Fig. 3 Three PDC algorithms applied to a real-world dataset. PDCs are shown for people taking a ACE inhibitors, b statins and c thyroid hormones. Each boxplot is for a combination of PDC definition (labelled on the left) and follow-up period (coloured and identified in legend). Each shows the 25th and 75th percentiles at either end of the box, the 50th percentile as a black line in the middle, and up to four ‘whiskers’ at the 5th, 10th, 90th and 95th percentiles. The asterisk in each box is the mean. PDC3 is calculated such that gaps of 0.5, 1 and 1.5 relative to the average number of days in each prescription are factored out of the denominator on the assumption that the person has gone elsewhere for their supply during that time
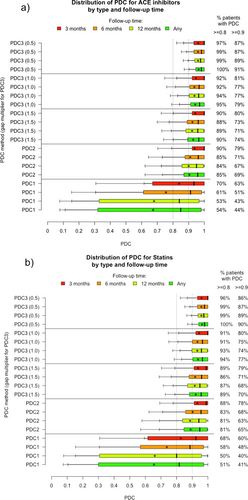
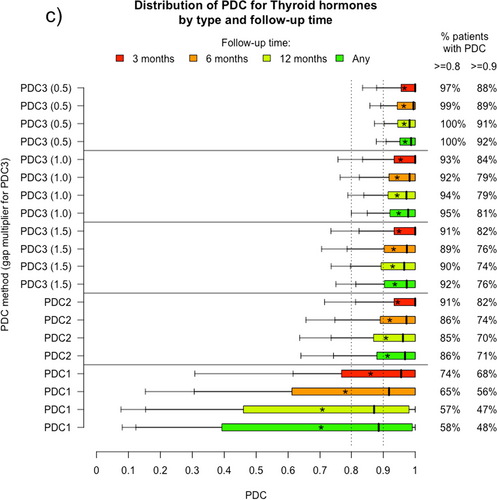
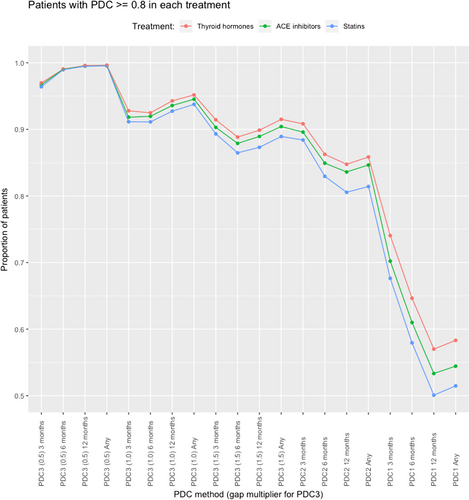
Fig. 4 Comparison of proportion of patients with PDC ≥ 0.8 in each drug class (thyroid hormones, ACE inhibitors, and statins)
Additional file 1: Figure S1.
Download MS Word (575.3 KB)Additional file 2: Table S1.
Download MS Word (53.1 KB)Availability of data and materials
The dataset analysed during the current study is not publicly available because it comes from a privately owned, commercial database and is restricted by a privacy policy. The dataset can be requested under a confidentiality agreement. Our specifications in the manuscript provide sufficient guidance for readers to develop the adapted Proportion of Days Covered (PDC) algorithms. Our code is not currently packaged as an R package, however we would be happy to share our code on request.