
Figures & data
Fig. 1 Flowchart of patient recruitment
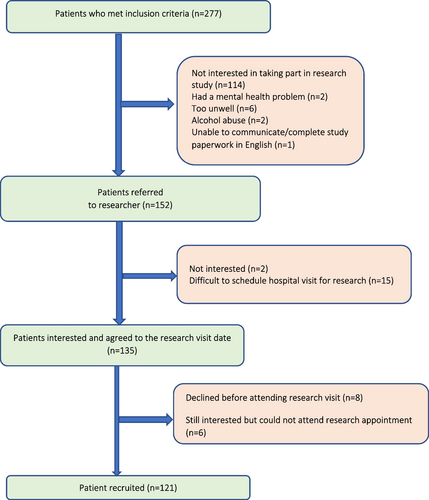
Table 1 Patient characteristics
Table 2 Metformin regimes taken by recruited patients
Fig. 2 Number of patients who sometimes, often, or always engaged in non-adherent behaviours to metformin stated in the MARS questionnaire
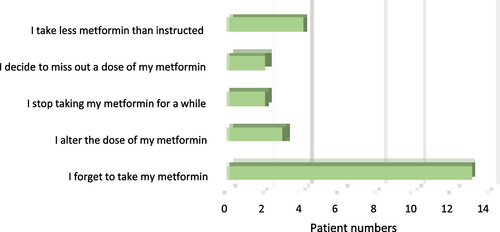
Fig. 3 Level of metformin exposure in recruited patients
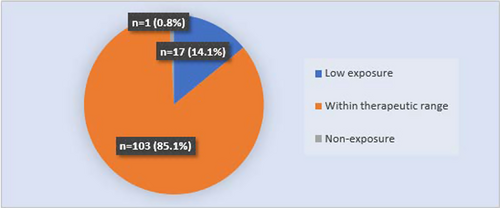
Fig. 4 Comparison of results of metformin adherence classification of adult patients with type 2 diabetes using the different methods of assessment. MARS: medication adherence report scale; DBS: dried blood spot
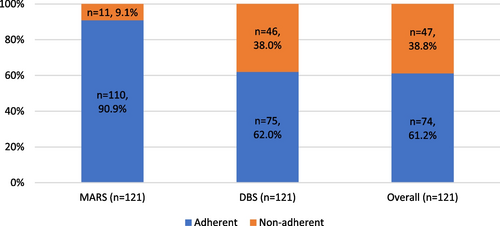
Table 3 HbA1c and random glucose levels as outcomes for non-adherence
Table 4 HbA1c and random glucose levels as outcomes for exposure
Table 5 Univariate analysis of possible factors affecting metformin adherence
Table 6 Factors independently linked to metformin adherence using logistic regression analysis
Additional file 1: Fig. S1.
Download TIFF Image (487.8 KB)Additional file 2: Fig. S2.
Download TIFF Image (338.7 KB)Availability of data and materials
The data used to support the findings of this study are included in this published article.