
Figures & data
Table 1 Descriptive statistics of the sample
Fig. 1 Tender savings compared to the number of competitors. Tender savings are calculated as the official list price minus the confidential discount obtained on the winning product through the tender. The number of competitors is the number of bidders in the tender
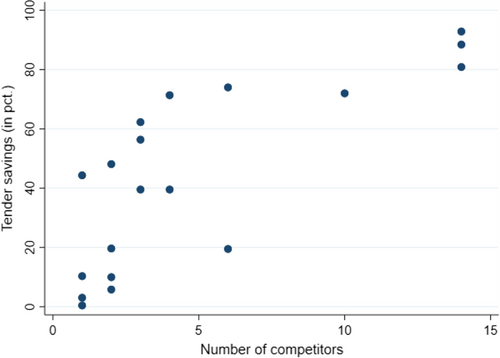
Fig. 2 Tender savings compared to the number of days since market authorization. Tender savings are calculated as the official list price of the winning product price minus the confidential discount obtained through the tender. The number of days since market authorization is the number of days the winning product has been on the Danish market
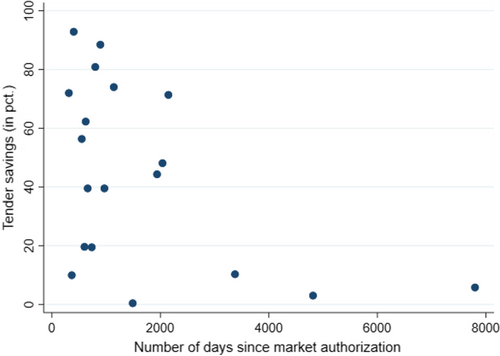
Table 2 Pairwise correlation and (p-values)
Table 3 Regression results from analyzing percentage discount rate
Availability of data and materials
The data that support the findings of this study may be available at request from Amgros I/S, https://amgros.dk/kontakt/, but restrictions apply to the availability of these data, and so they are not publicly available.