
Figures & data
Table 1 Sample size
Table 2 Socio-demographic characteristics of respondents
Fig. 1 Compliance with the storage temperature with the WHO standards in different health facilities. The blue line indicates the Mean Kinetic Temperature (MKT) measured in Pharmacy stock. The orange line highlights the Mean Kinetic Temperature measured in the vaccination program, while the green line indicates the Mean Kinetic Temperature measured in private retail pharmacies. These MKT were caught after the application of data loggers Tempmate M1. In pharmacy stock, we assessed 30 refrigerators. In vaccination, we assessed 25 refrigerators, in private retail pharmacies, we assessed 10 refrigerators
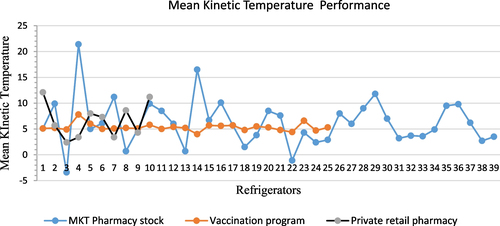
Fig. 2 Availability of cold chain equipment. Vertical bars represent different cold chain equipment availability and usability
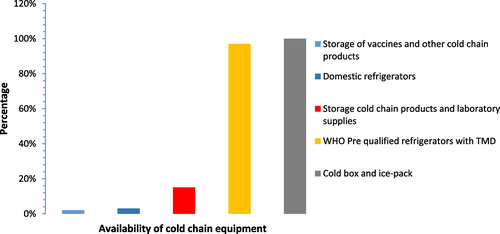
Table 3 Parameters of temperature monitoring system
Table 4 Knowledge of cold chain storage good practices (n = 55)
Availability of data and materials
The data sets used in this study are available from the corresponding author on a reasonable request.