
Figures & data
Table 1 Characteristics of pharmaceutical industry
Table 2 Number of employees working in the industries
Table 3 Comparison of production before (2016/2017) and after (2018/2019) the introduction of the 12% import verification fees
Fig. 1 Average units of different dosage forms produced from 2016 to 2019
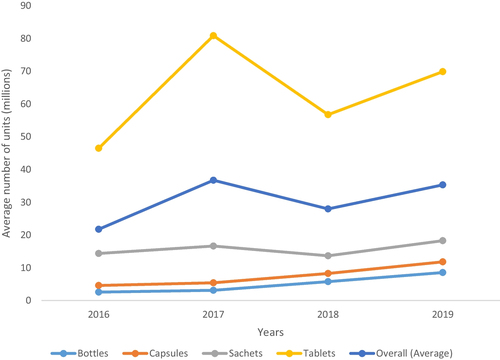
Table 4 Installed equipment capacity for granulation/blending line, compression machine, capsulation machine, BFS filling machines and oral rehydration salt (ORS) line
Table 5 Availability of critical quality control equipment
Table 6 Capacity of installed utilities
Table 7 Perceptions of KIs on impact of 12% increment on local production
Availability of data and materials
The data for the study are available from the corresponding author upon reasonable request.