
Figures & data
Table 1 Demographic distribution characteristics of the participants (N = 322)
Fig. 1 Types of CPD programs (n = 322)
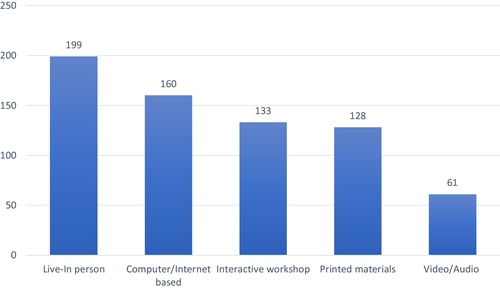
Fig. 2 Motivation for attending CPD (n = 322)
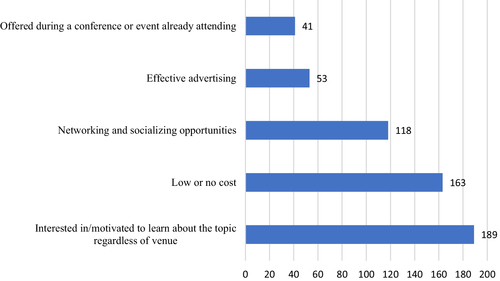
Table 2 Barriers to attending CPD (N = 322)
Table 3 Interests of pharmacists towards CPD topics (N = 322)
Table 4 Responsible organizations for the quality and content of CPD programs (n = 322)
Table 5 Bivariate analysis of factors associated with attending CPD activities (n = 322)
Table 6 Multivariate models for key factors of attending CPD activities (N = 322)
Availability of data and materials
The questionnaire is available on the request.