
Figures & data
Table 1 Top 25 BNF sections by number of Items
Fig. 1 Relative development in Primary Care prescribing mental and physical health medication before and over the pandemic. Shows a rolling previous 12 month total prescriptions by medication class for each month, against the linear extrapolation based on the previous 3 years 2017 to 2019. Results are standardised to the values for the year April 2017_March 18. The time intervals of the main England lockdowns are shown
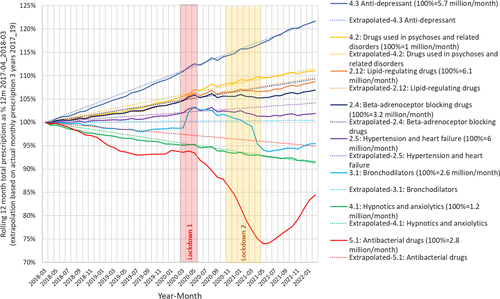
Table 2 Actual average prescriptions/month over the pandemic 2020 and 2021 were compared to the expected based on extrapolation of 2017 to 2019 giving an expected annual growth (EAG) for each class
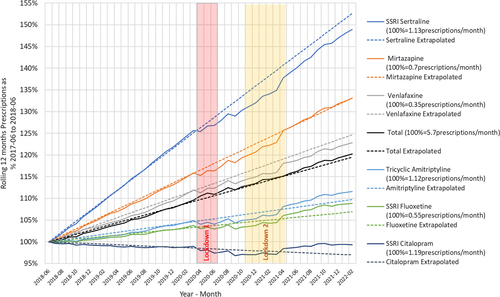
Fig. 2 Relative development of prescription for the top six antidepressant agents over the pandemic period. Results are standardised to the values for the year June 2017_May 18. The time intervals of the main England lockdowns are shown
Availability of data and materials
The data that support the findings of this study are available from the corresponding author upon reasonable request.