
Figures & data
Table 1 Sociodemographic characteristics of PPs (n = 301), Dessie city administration, 2019
Fig. 1 Average time spent by PPs (n = 301) with patients in Dessie city administration, north-east Ethiopia, 2019
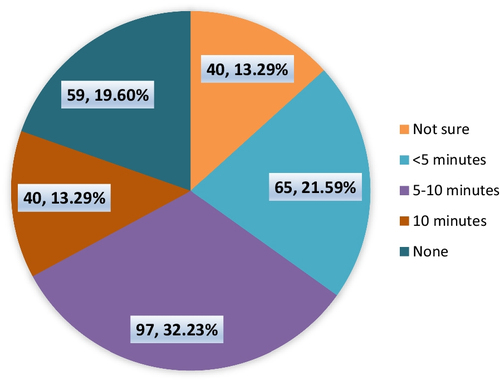
Fig. 2 Workplace of the PPs (n = 301), Dessie city administration, north-east Ethiopia, 2019
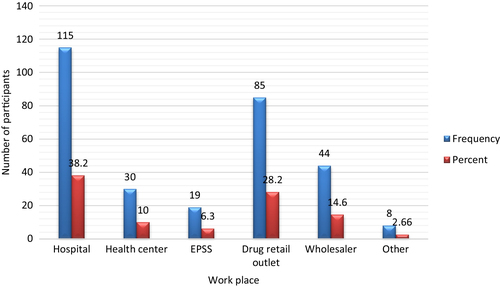
Fig. 3 Working units of PPs (n = 301) in Dessie city administration, north-east Ethiopia, 2019
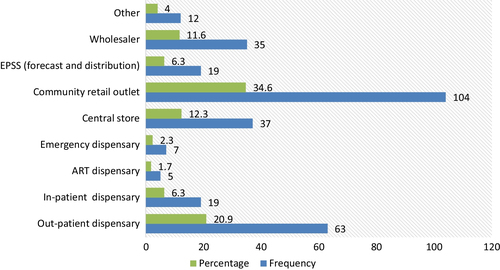
Table 2 Perception of PPs’ (n = 301) roles in Dessie city administration, north-east Ethiopia, 2019
Table 3 PPs' (n = 301; after dichotomizing to binary outcomes) perceptions of their professional role in Dessie city administration in north-east Ethiopia, 2019
Table 4 Perception of PPs (n = 301), in line with pharmacy service-related factors, towards their professional roles in Dessie city administration, north-east Ethiopia, 2019
Table 5 Factors associated with the perception of PPs (n = 301) towards their professional roles in the Ethiopian health care system in Dessie city administration, north-east Ethiopia, 2019
Table 6 Sociodemographic descriptions of the key informants (n = 12), Dessie city, north-east Ethiopia, 2019
Availability of data and materials
The data that support the findings of this study are available within the article.