
Figures & data
Fig. 1 Flowchart of herbal product applications received at TMDA (2009–2020)
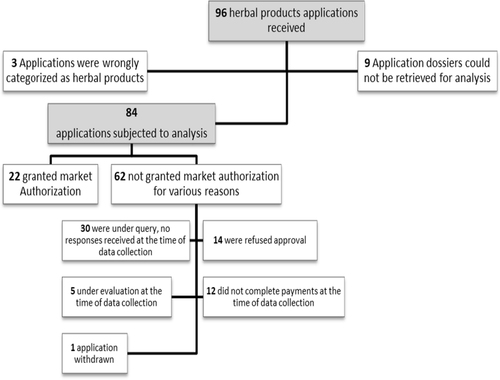
Fig. 2 Number of herbal medicine dossiers received and registered annually by TMDA (2009–2020)
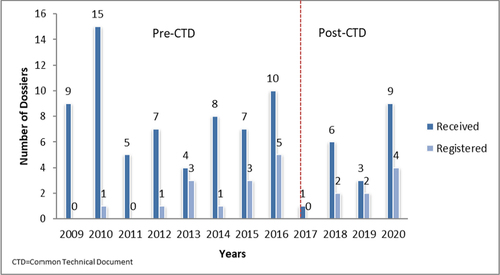
Table 1 Plants frequentlya used in herbal products submitted for market authorization in Tanzania (2009–2020) (N = 84)
Fig. 3 Number of multicomponent product applications with the number of herbal substances/plants in the products
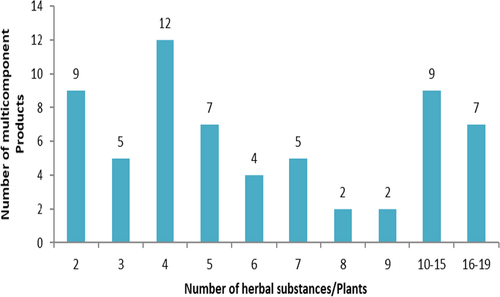
Table 2 Frequency of preclinical toxicity studies in herbal medicine dossiers submitted in Tanzania (2009–2020)
Table 3 Safety data submitted for ten frequently used plants in the herbal products applications (2009–2020)
Table 4 Safety data submitted in herbal products applications with herbal components with documented risks of adverse reactions or toxicity (2009–2020)
Table 5 Quality parameters with safety implications tested in herbal substances submitted for marketing authorization (2009–2020)
Table 6 Quality parameters with safety implications tested in finished herbal medicines submitted for marketing authorization (2009–2020)
Table 7 Safety data declared in package inserts of herbal medicines submitted for marketing authorization (2009–2020)
Table 8 Side effects declared in the registered herbal medicines package inserts or summary of product characteristics (2009–2020)
jppp_a_12370212_sm0001.docx
Download MS Word (15.8 KB)jppp_a_12370212_sm0002.docx
Download MS Word (17.2 KB)Availability of data and materials
The data are not available due to privacy and confidentiality.