Figures & data
Box 1. Drug summary.
Table 1. Summary of Phase II and Phase III AZLI clinical trials.
Figure 1. AIR-CF1 and AIR-CF2: change from baseline values for CFQ-R Respiratory Symptoms Scores, FEV1 (L), FEV1% predicted and Pseudomonas aeruginosa density in sputum.
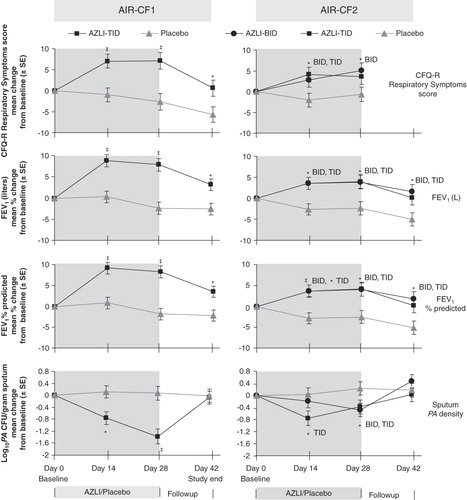
Table 2. Summary of CFQ-R results in Phase III AZLI trials: change from baseline at day 28.
Figure 2. AIR-CF3: effect of multiple AZLI cycles on change from baseline values for CFQ-R Respiratory Symptoms scores, FEV1 (L), FEV1% predicted and Pseudomonas aeruginosa density in sputum.
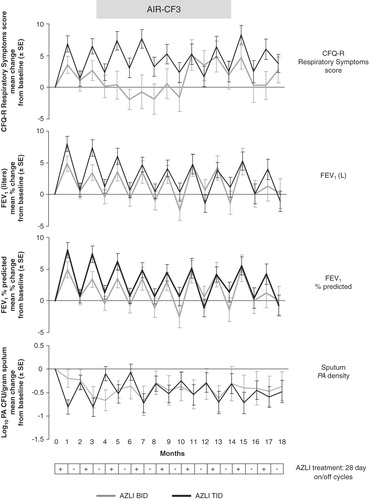
Table 3. Adverse drug reactions adjusted for study duration: comparison of pooled AZLI placebo-controlled trials, AIR-CF1 and AIR-CF2, and the open-label AZLI trial, AIR-CF3.