Figures & data
Figure 1. Cell-cycle phase distribution of cancer cells at the tumor surface and center. (A) fluorescence ubiquitination-based cell cycle indicator (FUCCI)-expressing MKN45 human stomach cancer cells were implanted directly in the liver of nude mice and imaged at day 35. (B) Histogram shows the cell cycle distribution in the tumor at day 35 after implantation. Histogram shows the distribution of FUCCI-expressing cells at different distances from the center. The vast majority of cancer cells are in G0/G1 below 120 μm from the tumor surface.
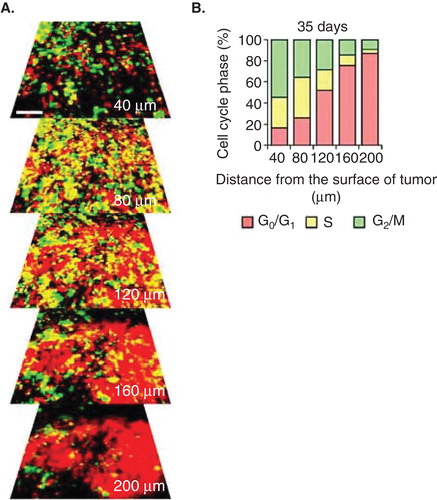
Figure 2. The efficacy of chemotherapy depends on the cell cycle-phase distribution within the tumor. (A) Representative images of a slowly-growing fluorescence ubiquitination-based cell cycle indicator (FUCCI)-expressing tumor in the liver before and after cisplatinum (CDDP) or paclitaxel treatment. (B) Histogram shows the cell cycle phase distribution within the tumor at the indicated time points after paclitaxel. (C) Histogram shows the survival rate of the cancer cells in G0/G1 phase or in S/G2/M phases after chemotherapy. The tumor is resistant to CDDP and paclitaxel because almost all the cells in the tumor are in G0/G1. Scale bars: 500 μm.
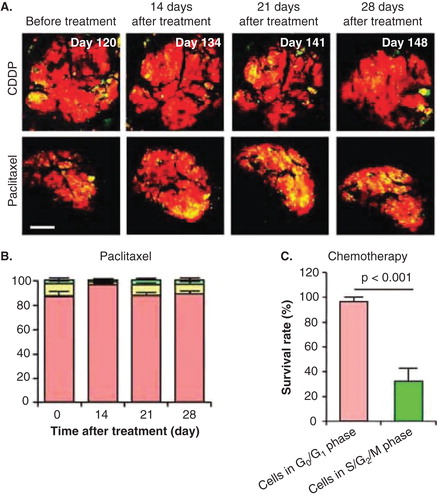
Figure 3. S. typhimurium A1-R-decoyed tumors became sensitive to chemotherapy. Fluorescence ubiquitination-based cell cycle indicator (FUCCI)-expressing MKN45 cells (5 × 10⁶ cells/mouse) were injected subcutaneously into the left flank of nude mouse. When the tumors reached ∼ 8 mm in diameter (tumor volume, 300 mm3), mice were administered iv S. typhimurium A1-R alone, or with CDDP (4 mg/kg ip) or paclitaxel (5 mg/kg ip) for five cycles every 3 days. (A) Representative images of cross-sections of FUCCI-expressing MKN45 subcutaneous tumors, untreated control, S. typhimurium A1-R-treated, CDDP-treated, paclitaxel-treated or treated with the combination of S. typhimurium A1-R and either CDDP or paclitaxel. (B) Growth curves of tumors derived from FUCCI-expressing MKN45 cells after treatment with chemotherapy, S. typhimurium A1-R or the combination of S. typhimurium A1-R and chemotherapy. The difference between control and CDDP-treated, p < 0.01; the difference between control and paclitaxel-treated, p < 0.05; the difference between control and S. typhimurium A1-R-treated, p < 0.05; the difference between control and the combination of S. typhimurium A1-R and either CDDP or paclitaxel-treated, p < 0.01; the difference between S. typhimurium A1-R and the combination of S. typhimurium A1-R and either paclitaxel or CDDP-treated, p < 0.05. (C) Histogram shows cell cycle phase of FUCCI-expressing MKN45 subcutaneous tumors, untreated control, S. typhimurium A1-R-treated, CDDP-treated, paclitaxel-treated, or the combination of S. typhimurium A1-R and either cisplatinum or paclitaxel-treated. These results show that S.typhimurium A1-R decoy of the cancer cells to cycle sensitizes the cancer cells to CDDP and paclitaxel. Scale bars: 500 μm.
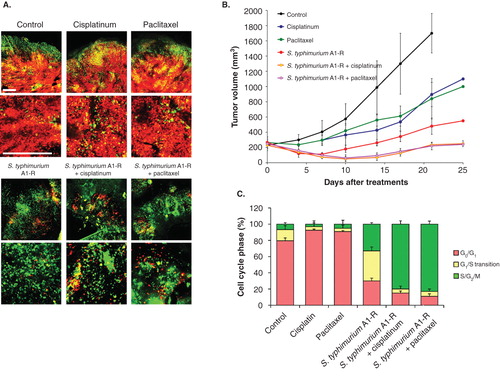
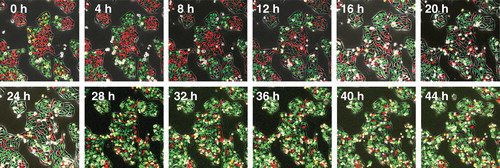
Figure 4. Time-lapse imaging of FUCCI-expressing HeLa cells treated with rMETase being trapped in S/G2 phase. After seeding on 35 mm glass dishes and culture over night, FUCCI-expressing HeLa cells were treated with rMETase at a dose of 1.0 unit/ml. The cells in G0/G1, S or G2/M phases appear red, yellow or green, respectively. These results show that rMETase treatment traps cancer cells in S/G2, a chemo-sensitive phase of the cell-cycle. Scale bar: 50 μm.