Figures & data
Figure 1. Percentage radioactivity remaining in the nose after different time intervals for BRC-loaded CS NPs and BRC solution (control) (n = 3, mean ± SD) is shown.
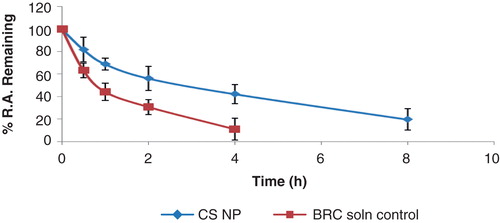
Table 1. Validation data of BRC in biological samples.
Figure 3. Typical chromatograms of (A) extracted BRC from plasma; (B) extracted BRC from brain homogenates are shown.
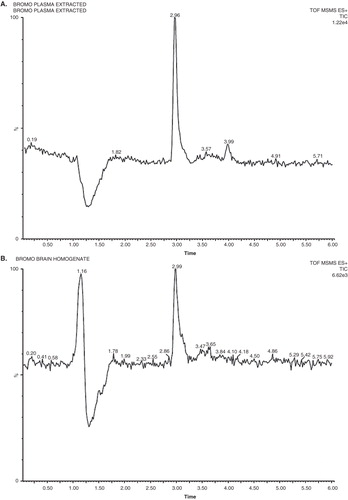
Figure 2. Mass spectrum of BRC precursor ion (protonated precursor [M+H]+ ions at m/z 656.12) and propranolol precursor ion (protonated precursor [M+H]+ ions at m/z 260.10) are shown.
![Figure 2. Mass spectrum of BRC precursor ion (protonated precursor [M+H]+ ions at m/z 656.12) and propranolol precursor ion (protonated precursor [M+H]+ ions at m/z 260.10) are shown.](/cms/asset/d03ba97b-7555-4cfe-8483-b95ac7717641/iedd_a_894504_f0003_b.jpg)
Table 2. Stability data of BRC in biological samples under different conditions.
Figure 4. Degradation products obtained after (A) acidic stress; (B) alkaline stress; (C) oxidation stress; (D) sunlight and (E) thermal stress are shown.
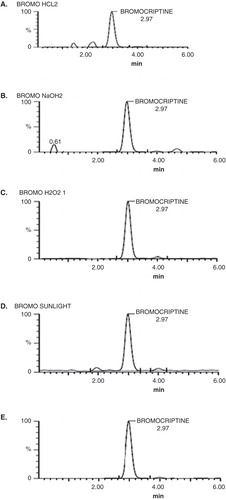
Table 4. Pharmacokinetic parameters of BRC solution and BRC-loaded CS NPs in mice following intravenous (i.v.) and intranasal (i.n.) administration.
Table 3. Brain and blood distribution of BRC solution and BRC-loaded CS NPs in mice after intranasal (i.n.) and intravenous (i.v.) administration.
Figure 5. Concentration–time profile of (A) brain concentration (B) plasma concentration and (C) brain:blood ratio of BRC solution and BRC-loaded CS NPs in mice after intranasal (i.n.) and intravenous (i.v.) administration (n = 3, mean ± SD) is shown.
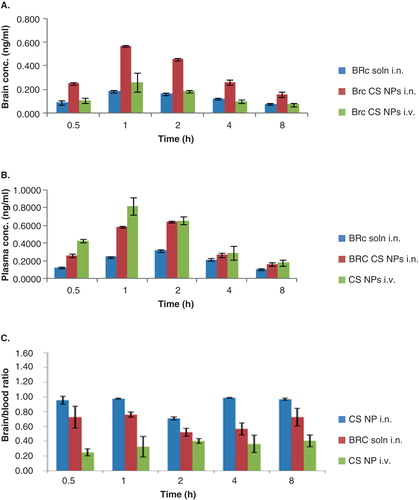
Figure 6. Brain section of (A) normal mice, (B) haloperidol-treated mice and (C) combined treatment of haloperidol and BRC-loaded CS NPs (i.n.)-treated mice is shown.
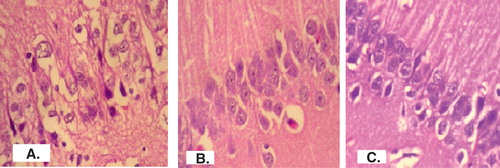
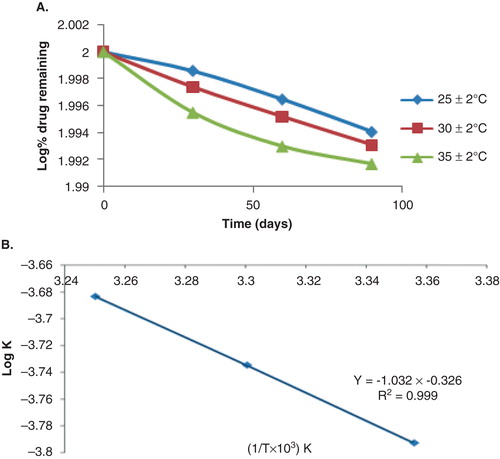
Figure 7. Representation of (A) log percentage drug remaining versus time and (B) Arrhenius plot for optimised BRC-loaded CS NPs.