Figures & data
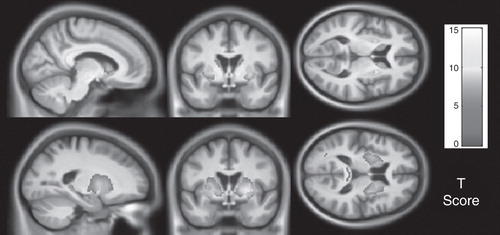
Figure 1. Parametric maps showing regions with statistically significant atrophy over 24 months in grey (top) and white matter (bottom) in far-from-onset premanifest subjects compared with controls. Results were adjusted for age, sex, study site and scan interval and are corrected for multiple comparisons with familywise error at the p < 0.05 level. Figure shown courtesy of the TRACK-HD study.